$NOTIn my opinion, Not can see the range of 0.014 in the short term, and if it faces a good volume, it will reach its main resistance range of 0.022, and in the long term, I think the range of 0.01 and 0.49 is not far from expected, of course, the long-term view is considered. .
NOTUSDT trade ideas

Possible Bullish Shark Pattern Bullish Shark Pattern PRZ would be level with the Support Zone
We've Passed the 100% Time RET.
Attention !!!
Please Do not Trade based on this idea.


NOTCOIN UPDATE BEARISH !!!!notcoin have bearish then going too moooon
we must wait for OB reations
just wait and see

Price reboundTON is currently in a triangular pattern, signaling a balance between buying and selling pressures. This pattern is often considered a precursor to the continuation of the previous trend or a trend reversal.
Support Range:
TON is approaching the identified support range. This support range acts as a crucial point to prevent further price declines and can provide the basis for a price rebound and the start of an upward move.
Resistance Levels:
If the price rebounds from the support range, the key resistance levels are at $0.013 and $0.014. These levels can be considered price targets for an upward move.
Keep TON on your watchlist.

NOTUSDT: For now sell only ! Dear Traders,
We have been closely monitoring the NOTUSDT charts and the current trend is concerning. The absence of bullish momentum is a cause for concern and it appears that the downward movement may continue. There are several key indicators that I am closely monitoring for any sign of a reversal. Until then, caution is advised when trading this pair. It is essential to conduct thorough research and consider your own risk tolerance before making any trading decisions. Furthermore, the recent economic data also may not support crypto currency to continue dominating in bullish pattern like it did since the beginning of the year. If the price do drop to our level it will be an excellent opportunity to buy swing. So we wish you all the best in trading and also do a proper research before taking any entries.
like and comment, for more do follow us.

NOTCOIN Bullish Movement: Heading Towards $0.01300Analysis:
Following recent market developments, NOTCOIN is showing signs of bullish movement. The price is moving towards the $0.01300 region, indicating the formation of the first wave of the bullish Luftwaffe pattern.
Key Points:
Market Developments: Recent market developments have sparked renewed interest and confidence in NOTCOIN, leading to increased buying pressure.
NFP Impact: The Non-Farm Payroll (NFP) report released today significantly affected the market. As a result, we observed a Bitcoin price drop, which caused traders to panic sell across the crypto market. Despite this, NOTCOIN is demonstrating resilience and is forming the first wave of a bullish Luftwaffe pattern.
Support Level: The $0.01100 region has shown strong support, acting as a solid foundation for the current upward movement.
Target: Based on current market momentum and technical indicators, the next significant resistance level appears to be around $0.01300.
Technical Indicators:
Luftwaffe Pattern Formation: The first wave of the bullish Luftwaffe pattern is forming, indicating a potential strong upward movement.
Moving Averages: The 50-day and 200-day moving averages are converging, indicating potential for a bullish crossover.
Relative Strength Index (RSI): Currently trending upwards, suggesting increasing buying momentum.
Volume: There has been a noticeable uptick in trading volume, supporting the bullish outlook.
Conclusion:
With the support at $0.01100 holding strong and the market reacting positively to recent developments, NOTCOIN is poised for a move towards $0.01300. The market's response to the NFP report, causing a Bitcoin price drop and subsequent panic selling, adds an extra layer of volatility to monitor. The formation of the first wave of the bullish Luftwaffe pattern suggests a promising upward trend. Traders should watch for potential pullbacks and confirm the uptrend with volume and momentum indicators.
Disclaimer: This analysis is for informational purposes only and should not be considered financial advice. Always do your own research before making any trading decisions.

NOTNOT dropping more to the downside, did not break through RS zone which is very strong sigh to looking for Sell.

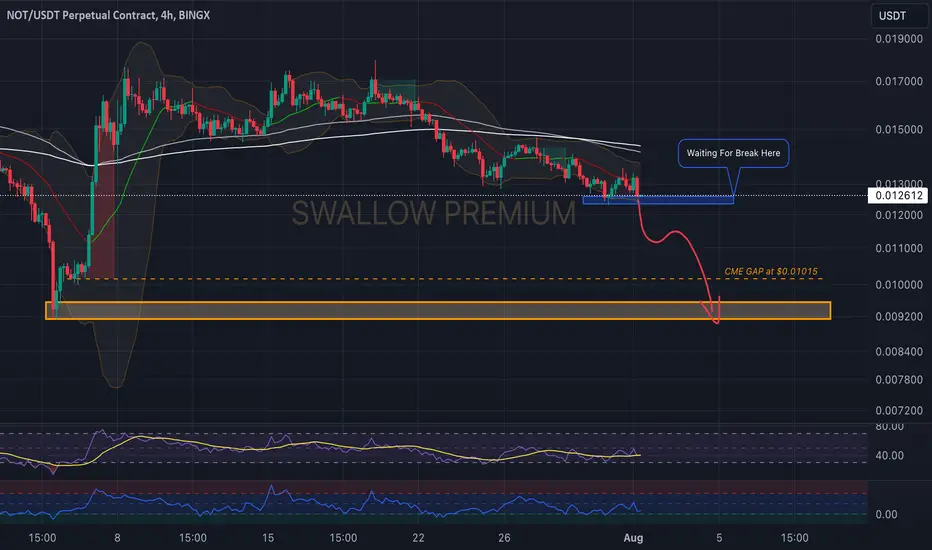
Notcoin (NOT): Waiting For Breakdown / Final Confirmation!Notcoin is looking interesting after breaking the branch of EMAs, where price is now possibly heading towards lower zone (to close the CME GAP).
As of now, we are looking for final confirmation here but there are high chances of see the breakdown from there, As soon as we see it, we will be looking for short 😉
Swallow Team
Idea to LONGNOT is currently with hype.
In term of pattern,
we are arriving at the end of the big triangle.
we are are on a triple bottom
On a support

NOT WAITING FOR FALSE BREAKOUT Hi dear treaders
Price tested the downtrend line as resistance, the 0.014 resistance area remains unbroken
Two marked support areas are missing.
We expect the price to go down to the third support area.
Let's see what happens
This is not financial advice ( DYOR )
Good luck 👍

Short-term price declineNotcoin is currently in a descending wedge pattern, indicating a short-term price decline. This pattern is usually accompanied by decreasing trading volume, signaling the end of selling pressure and the potential for a price reversal.
Support Levels:
There are two key support levels at 0.0117 and 0.0123 that can prevent further price declines. These levels are recognized as critical points for observing price changes, with a high probability of price reversal from these points.
Upward Potential:
After completing the descending wedge pattern, there is a potential for a pullback that could take Notcoin up to $0.014. This upward move would indicate a return of buyers and increased demand in the market.

NOTUSDTNotcoin couldn't stay in the bullish situation.
so,
The possibility of falling to the points, I specified is more than before.
( Between the prices of $0.007 and $0.011 )

#NOT/USDT#NOT
The price is moving within a descending channel pattern on the 1-hour frame and is expected to rise after it has been largely committed to it
We have a downtrend on the RSI indicator that is expected to break upwards and we have a trend to stabilize above it
We have a major support level in green at a price of 0.01250
We have a trend to stabilize above the moving average 100
Entry price 0.01260
First target 0.01340
Second target 0.01400
Third target 0.01460

NOTCOIN (NOT/USDT) IS NOW BULLISH Change of character is seen
Not has been in bearish move for some weeks. We have a clear break of trend 📈 to the upside

Notcoin Market Analysis: Price Drops to 0.01170Hello, Traders and Investors!
Today, we're taking a closer look at Notcoin (NTC), which has recently experienced a significant price drop, falling to 0.01170. Let's dive into the details and analyze what might be happening with Notcoin.
Price Action:
Notcoin has seen a sharp decline, reaching a new low of 0.01170.
This drop marks a significant decrease from its previous support level, indicating potential bearish sentiment in the market.
Technical Analysis:
Support Levels: The next key support level to watch is at 0.01050. If the price continues to fall, we could see it testing this level soon.
Resistance Levels: On the upside, resistance is expected at 0.01300. A break above this level could indicate a reversal in trend.
Moving Averages: The 50-day and 200-day moving averages are both trending downwards, reinforcing the bearish outlook.
RSI (Relative Strength Index): The RSI is currently at 30, suggesting that Notcoin is approaching oversold territory. This could lead to a potential rebound if buying pressure increases.
Market Sentiment:
Recent market sentiment has been largely negative, with increased selling pressure driving the price down.
News and developments in the broader cryptocurrency market may also be impacting Notcoin's price movement.
Fundamental Analysis:
It's essential to keep an eye on any news related to Notcoin's development team, partnerships, or project milestones. Positive news could help reverse the current downtrend.

Inverse Shoulder Head Shoulder NOTNOT gives me a sign of a inversed Shoulder head Shoulder pattern, this will be big if this is going to end like it. NOT can have big upward movement if it can get over the neckline.
Make sure u have a seatbelt on, so u dont miss the flight.
This is no financial advice, Alwayd DYOR.
What are your thoughts on NOT?

Will NOT give us an inverted shoulder head shoulder?It seems like NOT might go back down a bit to give us a inverted shoulder head shoulder pattern, if it is then this can work really great for all of us.
Keep an eye on NOT, it can be to late without even knowing.
This is no financial advice, always DYOR.
What are your thoughts?

NOTUSDT SHOWING POSITIVE SIGNSHello,
Welcome to the quick update of NOTUSDT. It was dumping since the last 2 days but as of now it has shown some positive signs with continuous green candles in the 4 HR TF.
We can take a position in this with the below details:
Entry: 0.0129 to 0.0132
Target: 0.0157 to 0.0169 in the short term and 0.022 to 0.026 in the long run
STOPLOSS: 0.0122
Until then, stay tuned and trade with caution, ensuring strict STOPLOSSES!!
This is not financial advice, please do your research before investing, as we are not responsible for any of your losses or profits.
Please like, share, and comment on this idea if you liked it.

What will NOT do?I expect NOT to try go up again for now and hit the resistance zone. Then NOT will reject and go down to support zone around 0.014 NOT will try to go back up and will break once to do a fake out (eliminate people). NOT will then go down a bit trade sideways and then go down back again to around 0.012 to follow the support zone of the first uptrend NOT had. From there we might see a breakout and NOT will reach new highs.
This is no financial advice, always DYOR.

Notcoin possible long entry point Personal idea: Notcoin faced deeper correction after it's rally which was of impulsive wave, I expect correction wave come to end here and we probably will see another impolsiv wave, support around circled area 0.014 with good volume will give opportunity to go up to highlighted area. Good 🙂 luck 👍

Not coin long term idea Buy not at those green area anywhere it comes first in spot only potential long term TPs are red zone good luck, I'll manage my TPs manually according to my risk managemt

