Notcoin chartThe flag pattern is a bullish patern that it can will brake of above and touch the last high and new ATH
#NOT IS A GEM 💎
TO THE MOON🚀🚀
NOTUSDT trade ideas


NOTCOIN support and resistance by a noob :0Hi there, I just started trading a week ago...
So tell me if i'm wrong and help to grow :))

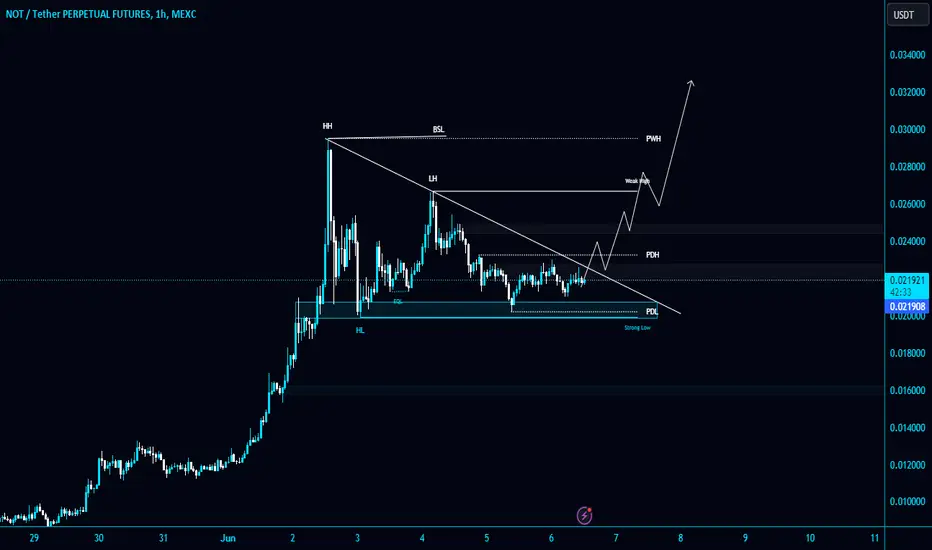
#NOT/USDT is consolidating after a huge bullish momentum in 1-ho#NOT/USDT is consolidating after a huge bullish momentum in 1-hour TF!
GETTEX:NOT needs to clear the trendline to gain the bullish momentum. The local resistance level is PWH $0.029465. Wait for BO/retest to long it.
Not/Usdt On The Verge Of Breakout Not/Usdt looking promising for the next leg up. I am waiting for a breakout of the trendline. In case of a successful breakout, NOT/USDT will likely soar. This is not financial advice; please do your own research.

LONGCurrently, NOT is undergoing correction in the falling red channel.
In addition, it is retesting the strong demand area highlighted in green.

Notcoin(NOT) Analysis===>>(RR:2.27)Notcoin(NOT) has succeeded in breaking the Downtrend line .
Also, we can see Regular Divergence(RD+) between two Consecutive Valleys.
According to the theory of Elliott Waves , Notcoin(NOT) has successfully completed 5 waves .
I expect Notcoin(NOT) to rise to the targets I have outlined in the chart.
Note: An important point you should always remember is capital management and lack of greed.
Notcoin(NOT) Analyze (NOTUSDT), 15-minute time frame ⏰.
Do not forget to put Stop loss for your positions (For every position you want to open).
Please follow your strategy; this is just my Idea, and I will gladly see your ideas in this post.
Please do not forget the ✅' like '✅ button 🙏😊 & Share it with your friends; thanks, and Trade safe. [/b

#NOT/ 50% growth soon!!Hello everyone
An eroding bearish move towards the key support of 1923 indicates that the decline is unlikely to continue and we are bullish again.
The growth form can be based on an expanded triangle or DROP and the formation of a BEARISH channel before growth!!
The targets are indicated in the figure


notust is about to fly highernotust is in uptrend forming a falling wedge pattern, after breakout the vertical trendline the price will fly to marked area

Nothing !!!Hello
COINEX:NOTUSDT
As you can see, Notcoin is in a bullish flag, which means that if the price can break the flag, the price can rise. Also, the Bullish hidden divergence supports this signal.
❗ Note that if the Pennant is broken down with the power of descending candles, our analysis will fail.
Traders, if you liked this idea or have your opinion on it, write in the comments, We will be glad.
_ _ _ _ __ _ _ _ _ _ _ _ _ _ _ _ _ _ _ _ _ _ _ _ _ _ _ _ _ _ _ _
✅Thank you, and for more ideas, hit ❤️Like❤️ and 🌟Follow🌟!
⚠️Things can change...
The markets are always changing and even with all these signals, the market changes tend to be strong and fast!!

NOT Any Token!Hello TradingView Family / Fellow Traders. This is Richard, also known as theSignalyst.
📈 NOT has been overall bullish, trading above the rising trendline in blue.
Currently, NOT is undergoing a correction phase within the falling red channel.
Moreover, it is retesting strong demand zone marked in green.
🏹 Thus, the highlighted blue circle is a strong area to look for trend-following buy setups as it is the intersection of the green demand zone and lower blue trendline acting as a non-horizontal support.
📚 As per my trading style:
As #NOT approaches the blue circle zone, I will be looking for bullish reversal setups (like a double bottom pattern, trendline break , and so on...)
📚 Always follow your trading plan regarding entry, risk management, and trade management.
Good luck!
All Strategies Are Good; If Managed Properly!
~Rich

$NOT (Notcoin) to be go higher if resistance trendline is brokenNotcoin has been stuck on s range for a few days now.
There's a high chance of seeing a bullish breakout on Notcoin if the resistance if the descending triangle pattern is broken

NOT COIN PREDICT. +40% OR -40%? RUSS VERSIONA short about video:
If we will get capitals in NOT we will have nice rise
else not will dump
Check video to get more info

toncoin notconi notAccording to the one-hour time frame, the support level of this cryptocurrency is 0.020462 Tether, and the price can probably touch the target of 0.022786 and 0.025262.

notcoin predictionnotcoin goes to 0.03 agian? or 0.015
say in comments
i think not coin go to 0.6 in 3 years

NOT making Bear sign NOT has make the LL and LH and i have set the target as below
Please make the SL and TP as below

notusdtSupport and press the rocket to cheer me up
Observe the ten percent loss limit
Stay away from Bitcoins
Feel free to buy and sell and post your comments

NOT Day Trade Long ScalpLying on 4Hr demand zone, anytime explosion possible,
- Risking 5% on it let us see how it goes as it always comes in Top Gainers.
- HH and HL on 4hr formation and retested the 4hr demand zone.
- I will hold till tp1 and tp2, tp3 is so risky and might be possible a wick can hit that, let us see
how BTC behaves.
Dont forget to follow for more interesting signals.

What is the next move ? NOTHING ?Hello guys
Due to the strong support and support of Notcoin,
The possibility of breaking the support line isnt that high
and there is a triangle pattern
i think next move will be bullish
its logical to enter on support line
( of course, if it is not broke )

NOT looking bullish here it has make the hl and broken the lower channel i sugguest we shoul buy n work as per the given tade plan

SHORT #NOTUSDTSHORT #NOTUSDT from $0.021246 stop loss $0.021488
15m TF. The asset is NOT actively falling and has currently formed a decline near horizontal levels. The daily trading volume has been increased to 1 billion. The local trend is downward (noticeably in decreasing trends), which indicates the dominance of sellers. I will consider accumulation above the levels, active sales and, as a result, an impulse breakdown.

NotcoinToday, June 5, it is expected that the price will go down from 0.02232 to 0.01821 and the specified blue range, and finally we will reach 0.035 Saudi.
This is not a financial offer.
