63 Moons : Approaching Red Band Resistance ( Monthly Time )63 Moons : Approaching Red Band Resistance.
(Monthly Time Frame)
( Not a Buy / Sell Recommendation
Do your own due diligence ,Market is subject to risks, This is my own view and for learning only .)
63MOONS trade ideas
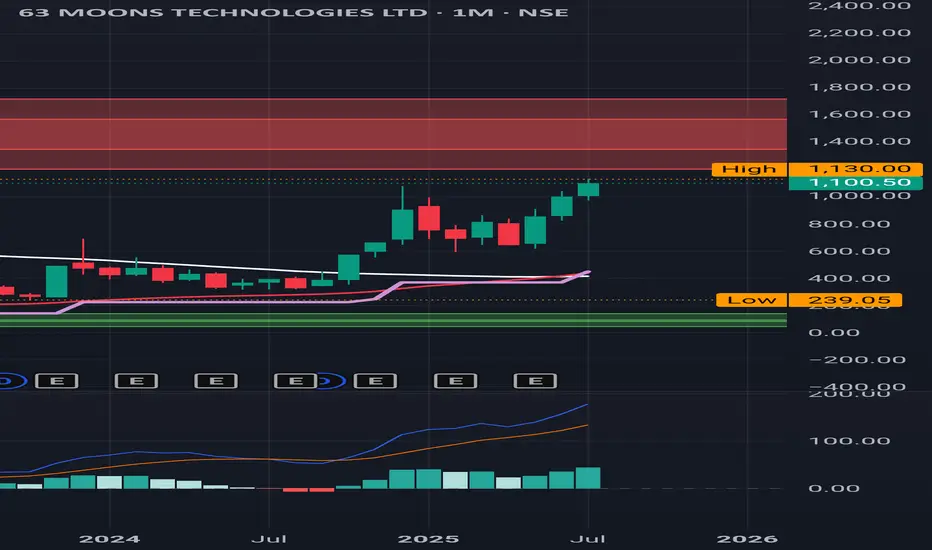
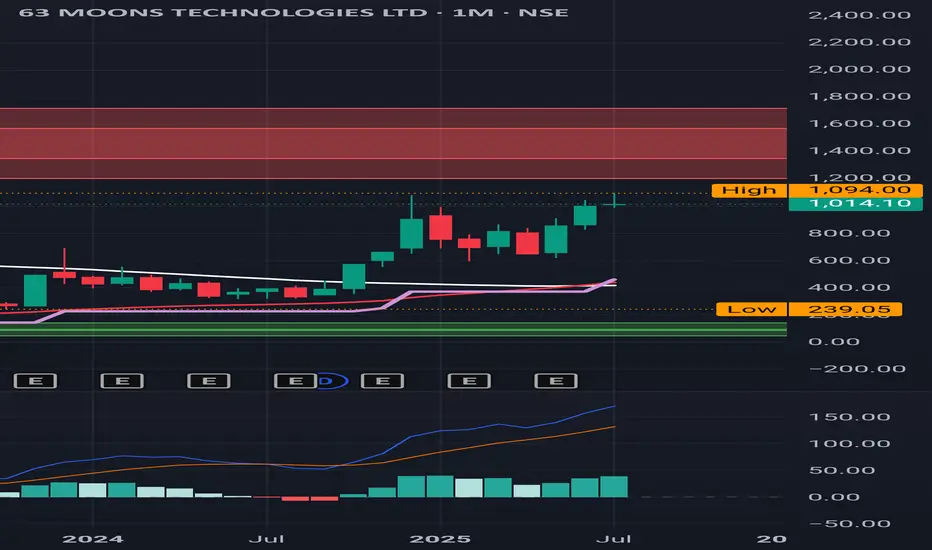
63 Moons : Monthly Time Frame. Red Band Resistance.
63 Moons : Monthly Time Frame. Red Band Resistance.
MACD looks extremely Strong .
( Not a Buy / Sell Recommendation
Do your own due diligence ,Market is subject to risks, This is my own view and for learning only
63 Moons PLAN FOR FUTURE INVESTMENTThanks for stopping by.
All analysis here is done strictly from an investor’s perspective — focusing on risk, return, valuation, and potential upside.
The notes cover key details. I’ve backed every thesis with my own analysis — no fluff, just what matters to investors.
If you find the idea useful or have suggestions, feel free to leave a comment. Always open to fresh insights.
Kind regards,
Psycho Trader

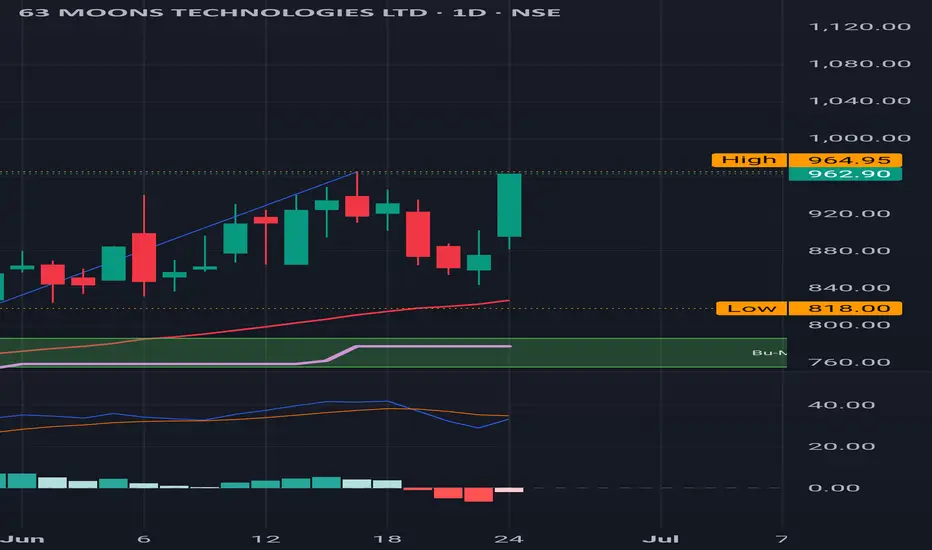
63 Moons : Sitting at the resistance 63 Moons : Sitting at the resistance.
If it clears this than the next level to be watched out for is 1000.
( Not a Buy / Sell Recommendation
Do your own due diligence ,Market is subject to risks, This is my own view and for learning only .)
63 Moons: Nice Rally after a Buy Signal,created a new resistance63 Moons: Nice rally after a buy a signal . Created a new resistance at 910 which needs to be watched out for.
( Not a Buy / Sell Recommendation
Do your own due diligence ,Market is subject to risks, This is my own view and for learning only .)

63 Moons : Continuing it's winning momentum after a Buy Signal63 Moons : Continuing it's winning momentum after a Buy Signal .
Last time it turned back from 864, which could be an important level to watch out for.
1070 is another major resistance if it crosses 1000 .
( Not a Buy / Sell Recommendation
Do your own due diligence ,Market is subject to risks, This is my own view and for learning only .)

63 Moons : Buy triggered 63 Moons : Buy triggered
Levels to watch for are 845 & 865
( Not a Buy / Sell Recommendation
Do your own due diligence ,Market is subject to risks, This is my own view and for learning only .)

63 MOONS : Bounced back from the support 63 MOONS : Bounced back from the support of 676.
( Not a Buy / Sell Recommendation
Do your own due diligence ,Market is subject to risks, This is my own view and for learning only .)

63 Moons : Important day today63 Moons : Important day today as it broke a very strong resistance of 790.
Already in a Buy trajectory
MACD is very strong .
( Not a Buy / Sell Recommendation
Do your own due diligence ,Market is subject to risks, This is my own view and for learning only .)

63 MOONS TECHNOLOGIES LTD S/RSupport and Resistance Levels:
Support Levels: These are price points (green line/shade) where a downward trend may be halted due to a concentration of buying interest. Imagine them as a safety net where buyers step in, preventing further decline.
Resistance Levels: Conversely, resistance levels (red line/shade) are where upward trends might stall due to increased selling interest. They act like a ceiling where sellers come in to push prices down.
Breakouts:
Bullish Breakout: When the price moves above resistance, it often indicates strong buying interest and the potential for a continued uptrend. Traders may view this as a signal to buy or hold.
Bearish Breakout: When the price falls below support, it can signal strong selling interest and the potential for a continued downtrend. Traders might see this as a cue to sell or avoid buying.
20 EMA (Exponential Moving Average):
Above 20 EMA(50 EMA): If the stock price is above the 20 EMA, it suggests a potential uptrend or bullish momentum.
Below 20 EMA: If the stock price is below the 20 EMA, it indicates a potential downtrend or bearish momentum.
Trendline: A trendline is a straight line drawn on a chart to represent the general direction of a data point set.
Uptrend Line: Drawn by connecting the lows in an upward trend. Indicates that the price is moving higher over time. Acts as a support level, where prices tend to bounce upward.
Downtrend Line: Drawn by connecting the highs in a downward trend. Indicates that the price is moving lower over time. It acts as a resistance level, where prices tend to drop.
RSI: RSI readings greater than the 70 level are overbought territory, and RSI readings lower than the 30 level are considered oversold territory.
Combining RSI with Support and Resistance:
Support Level: This is a price level where a stock tends to find buying interest, preventing it from falling further. If RSI is showing an oversold condition (below 30) and the price is near or at a strong support level, it could be a good buy signal.
Resistance Level: This is a price level where a stock tends to find selling interest, preventing it from rising further. If RSI is showing an overbought condition (above 70) and the price is near or at a strong resistance level, it could be a signal to sell or short the asset.
Disclaimer:
I am not a SEBI registered. The information provided here is for learning purposes only and should not be interpreted as financial advice. Consider the broader market context and consult with a qualified financial advisor before making investment decisions.

Mission to moonCan this be my best pick ⚒️
Let's just take this risk
As risk:reward is great
I am expecting almost 200-300% return from this stock as soon it is trading above 350
Stock : 63moons
Cmp: 460
Buy at cmp
Sl below 350 (Closing)
TGT : To the moon 🌙
PRO's:
Internsic value
Fii interested
CONs:
Already fallen stock so can again go to zero
Note: It's my own personal views on the stock not any recommendations to buy or sell the particular stock .. Do your own research and then decide...

63MOONS Positional Picks63Moons looks Strong positive..
Please refer the levels for more Info
Please consult your financial advisor before investing
All research for educational purposes only.

63 Moons behave like a real Moon Entry at 285 to 290
Target 389.20
Next average at 210
Next double average at 149
There are open sky from here...counter looks like very bullish and today's 10 % move confirms entry.
Don't miss it.
Long term very bullish counter

63 MoonsBuy above :- 177
Stop loss :- 162
Target :- 190
Time :- 45 trading days
Mainly the company is providing next generation technology , innovation platformfor creating a digital markets

63Moons : Flag Breakout + Inside Bar Breakout#63moons : 2 confirmation in a single chart
Flag Breakout & Inside bar Breakout
Good Strength in stock

good Q3 results. stock retest and Bounce from TL.# 63moontech. stpl loss close below TL or 148.
for tgt 200 250 310.
