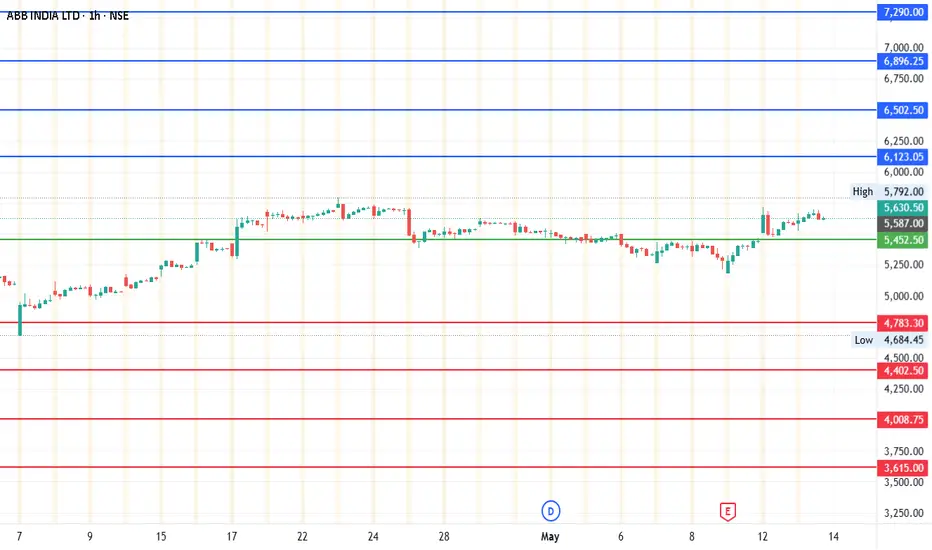
#ABB India | 1500-Point Move on the RadarAfter a strong breakout from the recent consolidation zone, ABB is showing renewed momentum with clear signs of accumulation and strength in trend.
We're now anticipating a fresh 1500-point move based on technical structure and price action dynamics.
Current Price: 5635
Mid-Point: 5452.50
Upside
Next report date
—
Report period
—
EPS estimate
—
Revenue estimate
—
89.05 INR
18.72 B INR
121.88 B INR
52.22 M
About ABB INDIA LTD
Sector
Industry
CEO
Sanjeev Sharma
Website
Headquarters
Bengaluru
Founded
1949
ISIN
INE117A01022
FIGI
BBG000CNH3X4
ABB India Ltd. engages in the manufacture of electric motors, generators, transformers, and electricity distribution and control apparatus. It operates through the following segments: Motion, Robotics and Discrete Automation, Electrification, and Process Automation. The Motion segment provides products and solutions that increase industrial productivity and energy efficiency. The Robotics and Discrete Automation segment focuses on the solutions in robotics, machine, and factory automation. The Electrification segment is involved in the provision of technology across the full electrical value chain from substation to the point of consumption. The Process Automation segment offers products, systems, and services designed for industrial processes. The company was founded on December 24, 1949 and is headquartered in Bengaluru, India.
Related stocks
Possible Swing Trade in ABB1. MACD Signal turned green
2. RSI crossing above 50
3. Stock returning after forming a base at 50.0% retracement
5. Good weekly close
6. Risk - Reward is more than 2
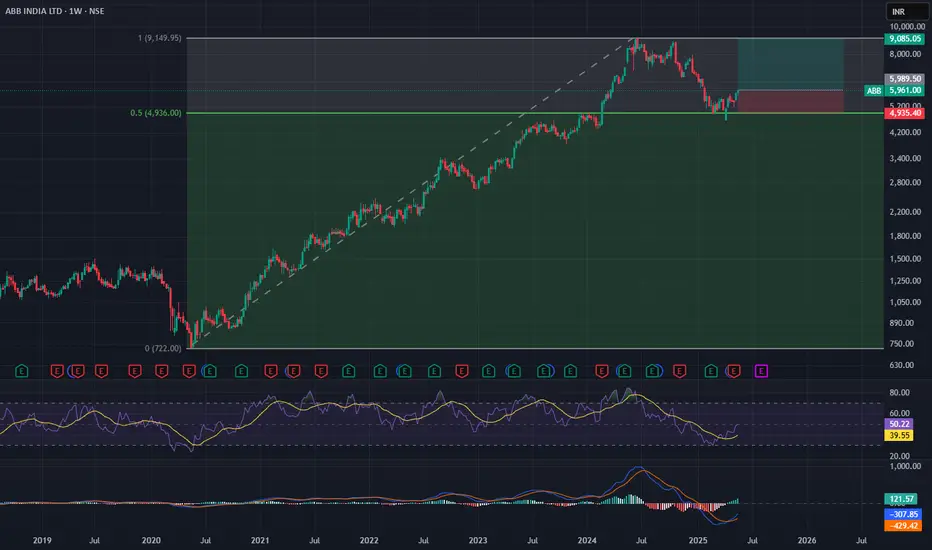
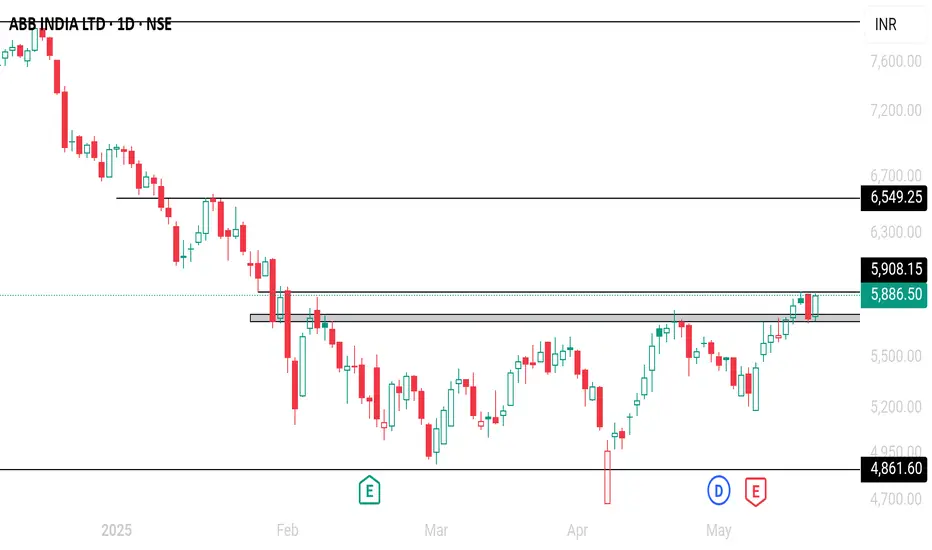
ABB India ???I Am little confused with my technical analysis on ABB India 1day time frame, need help,

Review and plan for 21st April 2025Nifty future and banknifty future analysis and intraday plan in kannada.
Quarterly results.
This video is for information/education purpose only. you are 100% responsible for any actions you take by reading/viewing this post.
please consult your financial advisor before taking any action.
----

ABB India Ltd. (NSE: ABB) - Technical Analysis & Market OutlookABB India Ltd. (NSE: ABB) - Technical Analysis & Market Outlook
Overview:
ABB India Ltd. has demonstrated significant price action over the past few years, with a strong uptrend followed by a corrective phase. The current price action suggests a potential reversal from key support levels, presen
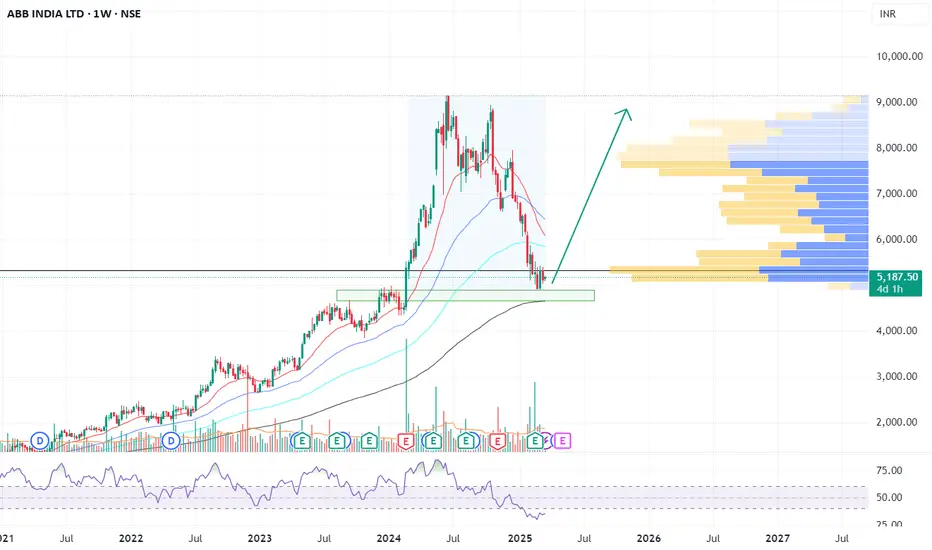
ABB - Short to mid-term analysis (NOT A BUY/SELL RECOMMEDATION)ABB is looking quite reasonable, and the chart indicates short-term bottom formation. Presently , a base for an upside would be 5112. If ABB crosses and sustains above 5112, then we can expect good upside upto 7116-7450+ . On the downside, risk is present if it breaches 4996. Upon breaching 4996, we

Review and plan for 19th February 2025 Nifty future and banknifty future analysis and intraday plan.
Result - action analysis.
This video is for information/education purpose only. you are 100% responsible for any actions you take by reading/viewing this post.
please consult your financial advisor before taking any action.
----Vi

ABB will have correction 30 - 35%?ABB has closed below 200 EMA on day time frame.
It has next demand support at 6600 & 6300.
Close below 6300 will confirm BAT pattern formation and this will lead to a correction up to 4400.
Target: 6600 / 6300 / 5500 / 5000 / 4400

ABB INDIA LTD S/R Support and Resistance Levels:
Support Levels: These are price points (green line/shade) where a downward trend may be halted due to a concentration of buying interest. Imagine them as a safety net where buyers step in, preventing further decline.
Resistance Levels: Conversely, resistance levels (re

See all ideas
Summarizing what the indicators are suggesting.
Neutral
SellBuy
Strong sellStrong buy
Strong sellSellNeutralBuyStrong buy
Neutral
SellBuy
Strong sellStrong buy
Strong sellSellNeutralBuyStrong buy
Neutral
SellBuy
Strong sellStrong buy
Strong sellSellNeutralBuyStrong buy
An aggregate view of professional's ratings.
Neutral
SellBuy
Strong sellStrong buy
Strong sellSellNeutralBuyStrong buy
Neutral
SellBuy
Strong sellStrong buy
Strong sellSellNeutralBuyStrong buy
Neutral
SellBuy
Strong sellStrong buy
Strong sellSellNeutralBuyStrong buy
Displays a symbol's price movements over previous years to identify recurring trends.
Frequently Asked Questions
The current price of ABB is 5,643.00 INR — it has decreased by −0.98% in the past 24 hours. Watch ABB INDIA LTD stock price performance more closely on the chart.
Depending on the exchange, the stock ticker may vary. For instance, on NSE exchange ABB INDIA LTD stocks are traded under the ticker ABB.
ABB stock has fallen by −0.72% compared to the previous week, the month change is a −6.74% fall, over the last year ABB INDIA LTD has showed a −24.26% decrease.
We've gathered analysts' opinions on ABB INDIA LTD future price: according to them, ABB price has a max estimate of 7,040.00 INR and a min estimate of 4,950.00 INR. Watch ABB chart and read a more detailed ABB INDIA LTD stock forecast: see what analysts think of ABB INDIA LTD and suggest that you do with its stocks.
ABB stock is 1.77% volatile and has beta coefficient of 1.64. Track ABB INDIA LTD stock price on the chart and check out the list of the most volatile stocks — is ABB INDIA LTD there?
Today ABB INDIA LTD has the market capitalization of 1.20 T, it has decreased by −5.76% over the last week.
Yes, you can track ABB INDIA LTD financials in yearly and quarterly reports right on TradingView.
ABB INDIA LTD is going to release the next earnings report on Aug 7, 2025. Keep track of upcoming events with our Earnings Calendar.
ABB earnings for the last quarter are 22.40 INR per share, whereas the estimation was 22.43 INR resulting in a −0.11% surprise. The estimated earnings for the next quarter are 21.57 INR per share. See more details about ABB INDIA LTD earnings.
ABB INDIA LTD revenue for the last quarter amounts to 31.60 B INR, despite the estimated figure of 33.80 B INR. In the next quarter, revenue is expected to reach 31.87 B INR.
ABB net income for the last quarter is 4.75 B INR, while the quarter before that showed 5.28 B INR of net income which accounts for −10.18% change. Track more ABB INDIA LTD financial stats to get the full picture.
ABB INDIA LTD dividend yield was 0.64% in 2024, and payout ratio reached 50.00%. The year before the numbers were 0.51% and 40.61% correspondingly. See high-dividend stocks and find more opportunities for your portfolio.
As of Jul 27, 2025, the company has 4.87 K employees. See our rating of the largest employees — is ABB INDIA LTD on this list?
EBITDA measures a company's operating performance, its growth signifies an improvement in the efficiency of a company. ABB INDIA LTD EBITDA is 23.22 B INR, and current EBITDA margin is 19.37%. See more stats in ABB INDIA LTD financial statements.
Like other stocks, ABB shares are traded on stock exchanges, e.g. Nasdaq, Nyse, Euronext, and the easiest way to buy them is through an online stock broker. To do this, you need to open an account and follow a broker's procedures, then start trading. You can trade ABB INDIA LTD stock right from TradingView charts — choose your broker and connect to your account.
Investing in stocks requires a comprehensive research: you should carefully study all the available data, e.g. company's financials, related news, and its technical analysis. So ABB INDIA LTD technincal analysis shows the sell today, and its 1 week rating is sell. Since market conditions are prone to changes, it's worth looking a bit further into the future — according to the 1 month rating ABB INDIA LTD stock shows the neutral signal. See more of ABB INDIA LTD technicals for a more comprehensive analysis.
If you're still not sure, try looking for inspiration in our curated watchlists.
If you're still not sure, try looking for inspiration in our curated watchlists.