Clear Break out 13 years ConsolidationGood for long entry break out retest on 1600 put SL below 1600 for long position.
ABB trade ideas


abb powerABB India is a public limited company domiciled in India and incorporated under the provisions of the Indian Companies Act. The ABB Group was formed in 1988 through a merger between Asea AB and BBC Brown Boveri AG. Initially founded in 1883, Asea AB was a major participant in the introduction of electricity into Swedish homes and businesses and in the development of Sweden’s railway network. In the 1940s and 1950s, Asea AB expanded into the power, mining and steel industries. Brown Boveri and Cie. (later renamed BBC Brown Boveri AG) was formed in Switzerland in 1891 and initially specialized in power generation and turbines. In the early to mid-1900s, it expanded its operations throughout Europe and broadened its business operations to include a wide range of electrical engineering activities.
In January 1988, Asea AB and BBC Brown Boveri AG each contributed almost all of their businesses to the newly formed ABB Asea Brown Boveri Ltd, of which they each owned 50 percent. In 1996, Asea AB was renamed ABB AB and BBC Brown Boveri AG was renamed ABB AG. In February 1999, the ABB Group announced a group reconfiguration designed to establish a single parent holding company and a single class of shares. ABB Ltd was incorporated on March 5, 1999, under the laws of Switzerland. In June 1999, ABB Ltd became the holding company for the entire ABB Group. This was accomplished by having ABB Ltd issue shares to the shareholders of ABB AG and ABB AB, the two companies that formerly owned the ABB Group. The ABB Ltd shares were exchanged for the shares of those two companies, which, as a result of the share exchange and certain related transactions, became wholly-owned subsidiaries of ABB Ltd. ABB Ltd shares are currently listed on the SIX Swiss Exchange, the NASDAQ OMX Stockholm Exchange and the New York Stock Exchange (in the form of American Depositary Shares).
Business area of the company
ABB India is a technology leader that is driving the digital transformation of industries. ABB has four customer-focused, globally leading businesses in Electrification, Industrial Automation, Motion, and Robotics & Discrete Automation, supported by the ABB Ability digital platform.
Products
Control Room Solutions
Drives
Low Voltage Products and Systems
Measurement and Analytics
Mechanical Power Transmission
Medium Voltage Products
Metallurgy Products
Motors and Generators
PLC Automation
Power Converters and Inverters
Robotics
Systems
Control Systems
Electric Vehicle Charging Infrastructure
Operations Management Software
Power Electronics
Safety
Turbo charging
UPS and Power Conditioning
Industries
Aluminium
Automotive
Buildings and Infrastructure
Cement
Channel Partners
Chemical
Data Centers
Food and Beverage
Industrial Automation
Life Sciences
Marine and Ports
Metals
Mining
Oil and Gas
Ports
Power Generation
Printing
Pulp and Paper
Railway
Smart Cities
Solar Power
Water
Wind Power
Services
Rapid response
Lifecycle management
Performance improvement
Operational excellence
History of ABB
ABB is the product of many acquisitions and mergers, but primarily the 1988 coming together of ASEA and BBC, formerly known as Brown Boveri, two of the proudest and best known names in European electrical engineering history.
1988- ASEA and BBC merge to form the new company, with headquarters in Zurich, Switzerland. The new group, which started operations on Jan. 5, 1988, had revenues of $17 billion and employed 160,000 people around the world.
1990- ABB launches Azipod, a family of electric propulsion systems that are fixed to the outside of ships providing both thrust and steering functions. They increase maneuverability, efficiency and the space available on board.
1998- ABB launches the FlexPicker, a delta robot uniquely designed for the picking and packing industry. Today, it's the leader in state-of-the-art high speed robotic picking and packing technology.
2000- ABB delivers world’s first commercial high-voltage shore-to-ship electric power, helping reduce greenhouse gas emissions from ships berthed at the Swedish port of Gothenburg.
2002- ABB links the AC networks of South Australia and Victoria with the world’s longest underground transmission. ABB also linked Conneticut and Long Island with the world’s first extruded HVDC submarine transmission.
2004- ABB launches its Extended Automation System 800xA providing a process automation system that has since been installed at thousands of applications delivering continuous productivity improvements.
2005- ABB delivers electricity through a DC (direct current) link originating 70 km away on land to a gas platform in the North Sea, helping avoid annual emissions of 230,000 tons of CO2 and 230 tons of NOX.
2008- NorNed, the longest submarine HVDC cable in the world at 580 km, links the power networks of Norway and the Netherlands with a transmission capacity of 700 MW.
2010- ABB links the Xiangjiaba hydropower plant in southwest China to Shanghai about 2,000 km away with an UHVDC connection with a capacity of ±800 kV and 7,200 MW of power.
2012- ABB develops a hybrid DC breaker suitable for the creation of large inter-regional DC grids. This breakthrough solves a technical challenge that has been left unresolved for over a hundred years and was perhaps one of the main influencers in the 'war of currents'.
2014- ABB unveils the world’s first truly collaborative robot: YuMi®. The innovative human-friendly dual arm robot with breakthrough functionality unlocks vast global additional automation potential in industry.
2017- ABB launches ABB Ability, its industry-leading digital solutions offering, connecting customers to the power of the Industrial Internet of Things. ABB Ability turns data insights into the direct action that 'closes the loop' and generates customer value.
2018- ABB joins the FIA Formula E Championship as the series' title partner to form the newly-named ABB FIA Formula E Championship. The race series serves as a competitive platform to test and develop e-mobility-relevant electrification and digitalization technologies.
2019- ABB revolutionizes the low-voltage switchgear: The bus plate technology combined with the connectivity of the ABB Ability platform mark the next innovation leap, making ABB’s NeoGear the safest option for operators, maximizing efficiency and reducing costs for digitalized industries.
2020- ABB India has launched and listed low voltage (LV) motors on its e-commerce marketplace, eMart. The portal is the first company-owned e-market place in India to host a wide range of made-in-India motors.
Before the ASEA and BBC merger- ASEA
1883- Ludvig Fredholm establishes Elektriska Aktiebolaget in Stockholm as manufacturers of electrical lighting and generators.
1889- Jonas Wenström invents the three phase system for generators, transformers and motors.
1890- Elektriska Aktiebolaget merges with Wenströms & Granströms Elektriska Kraftbolag to form Allmänna Svenska Elektriska Aktiebolaget, later shortened to ASEA.
1893- ASEA builds the first three-phase transmission system in Sweden.
1926- ASEA supplies locomotives and power converters for the new Stockholm to Gothenburg railway.
1932- ASEA builds the world’s largest self-cooling transformer rated at 2,500 kVA (kilovolt ampere).
1942- ASEA builds the world's first 120 MVA, 220 kV transformer in the Stockholm Elverks Värtanstation.
1952- ASEA designs and installs the first 400 kV AC cable – a 70 m low pressure oil-filled (LPOF) cable connecting an underground power station (built to withstand an atomic bomb) to the Swedish grid.
1953- ASEA is the first company in the world to manufacture synthetic diamonds.
1954- ASEA installs the world’s first HVDC transmission line, providing 20 MW, 100 kV to the Isle of Gotland over a distance of 96 km.
1963- ASEA achieves a major technological breakthrough with the introduction of an improved thyristor able to handle substantially more electrical current than existing devices
1972- ASEA builds the first nuclear power plant in Sweden and goes on to build nine of the country’s 12 reactors.
1978- ASEA launches one of the first industrial robots.
1986- ASEA employs 71,000 people and reported revenues of $6.8 billion and income after financial items of $370 million.
BBC
1891- Charles E. L. Brown and Walter Boveri establish Brown, Boveri & Cie in Baden, Switzerland. Shortly afterward, Brown, Boveri is the first company to transmit high-voltage power.
1893-BBC supplies Europe’s first large-scale combined heat and power plant producing alternating current.
1901-BBC builds the first steam turbine in Europe.
1993- BBC obtains the patent for turbine rotors constructed from individual steel disks that are welded together.
1939-BBC builds the first combustion gas turbine for generating electricity.
1943-BBC builds the first 110 kV high-speed air blast circuit breaker.
1944- BBC develops the first high-speed locomotive with drive shafts fitted exclusively in bogies.
1953- The first data transmission at carrier frequency is performed by BBC over a 735 kV high-voltage line to the power station control unit.
1965- BBC builds the first 110 kV GIS (gas-insulated switchgear) allowing circuit breakers to operate safely in a confined space.
1969- BBC develops the first gearless cement drive in the world.
1971- BBC builds the most powerful transformer in the world at 1,300 MVA (megavolt ampere).
1978- BBC starts production of bipolar semiconductors at its dedicated Lenzburg semiconductor facility.
1984- Installation of the first of nine BBC generators in the world’s largest hydroelectric power station at Itaipú in South America.
1986- BBC employs 97,000 people and reported revenues of $8.5 billion and an income after financial items of $132 million.


FIBO LEVELABB FIRST TRY TO BREAK FIBO LVL AND THE COME FOR RETRACETMENT AND TAKE SUPPOET ON TREANDLINE
NOW IF IT'S BREAK 1109 LVL AND S-RSI GIVE CONFIRMATION GO FOR BUY


ABBABB
Trying to break of the Pattern
Should break and hold for good up movement.
View Neutral to bullish

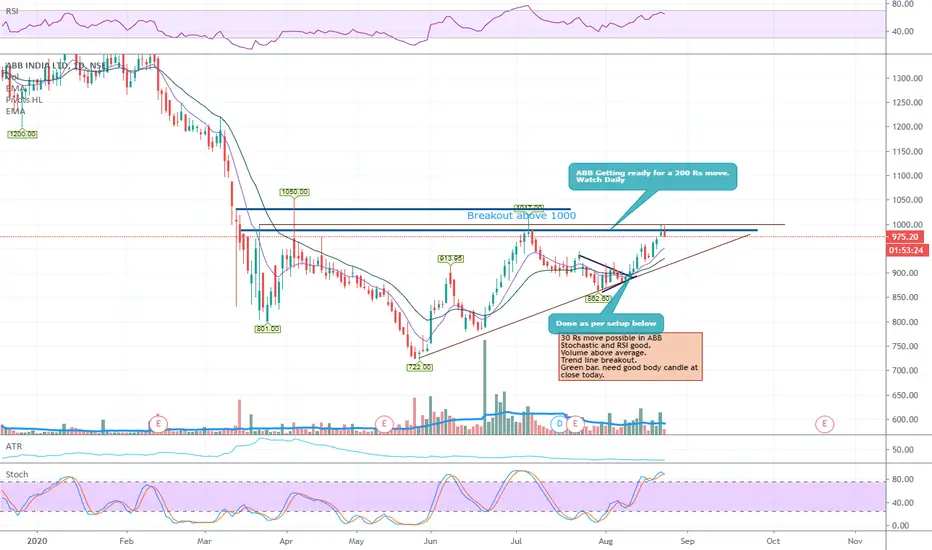
ABB - Breaking outABB.
Trying to push past the 999 high.
Getting ready for a 200 Rs move.
This stock when it moves it moves.
Else stagnant.
So have to watch this daily.

A simple setup, high probabilityABB has moved up impulsively, made a nice corrective structure in the form of a Flat (ABC). I think that the wave C of the Flat pattern is done and now it will head in the upside direction, as a continuation. A retest of the the previous highs is possible.
We are looking at close to 60-65% kind of price move in the current setup.
Low risk and good reward setup. If I were to trade this, my stop would be below the C, as in the charts.
** This is not a trade advice**


ABB from 16 July 2020A complete 1->2->3 wave pattern can be made on ABB ..
.use simple strategy to make money...
Trendline has been drawn once candle(Green candle) breaks the trendline --> following the MFI breakout
take trade
entry price === >> green candle ( high - low ) /2 + high
exit price ==>> 1R --> 2R as targets : R = risk --> nearest swing low
advance traders can also use ADX to maximise the profit
