clear breakout with high volumesgiven a big move with high volumes may consolidate and will be ready for a big move
ABBOTINDIA trade ideas

Abbott India Ltd. (ABBOTINDIA)I'm not a SEBI REGISTERED ANYLISIS
just for learning purpose
above the blue line close in D chart candle i will buy and put strictly SL to below red line...once candle close below Red line in D chart...i will close the Trade...
target check the chart
educational purpose only
oits simple ORB WITH VOLUME BREAKOUT STRATEGY...with small condition apply for selecting the stocks
owt not response for your profit and loss

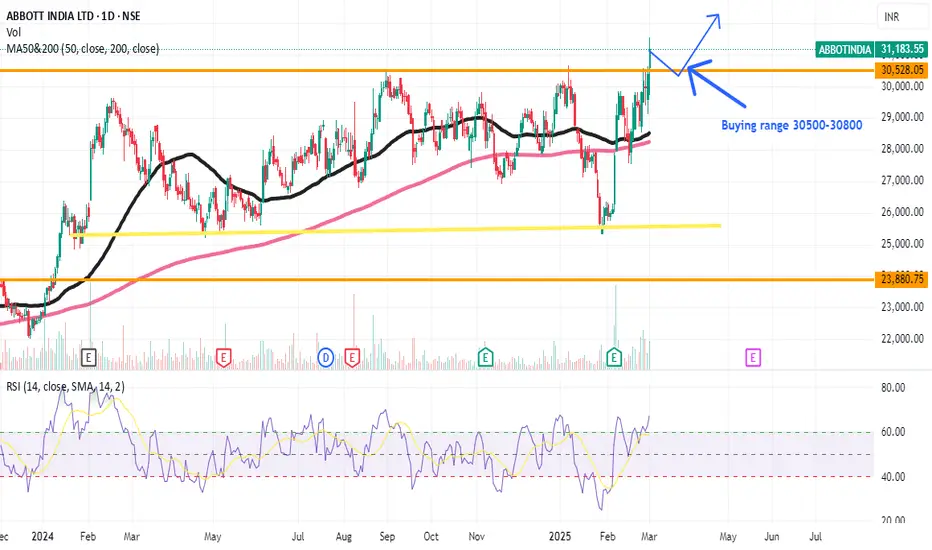
Abbotindia Breakout Buy with cautious. A fresh breakout has been seen on the weekly and as well as daily chart of the Abbotindia , Don't buy in hurry wait for the levels given around 30400- 30800 & on a bullish signal take the long entry for good target.
Near future target around Rs 33000-35000. This is for your educational purpose only.
ABBOTINDIA: Correction on the Horizon? **⚠️ ABBOTINDIA: Correction on the Horizon? 🚨**
🔍 **Strong Rally Faces Major Resistance!**
ABBOTINDIA has surged sharply from **₹25,874** to **₹29,683**, but it’s now approaching the **crucial resistance zone at ₹30,213**.
📉 **Why a Pullback is Likely?**
✅ **Resistance Zone at ₹30,213-30,500**
✅ **Overbought after a sharp rise**
✅ **Previous reactions from this level suggest selling pressure**
📊 **Key Downside Targets in Case of Correction:**
🔹 **₹28,250** (SMA-44 Support)
🔹 **₹26,800** (Previous Demand Zone)
💡 **Trading Plan:**
🔻 **Wait for bearish signals near ₹30,213**
🔻 **Short-term pullback to ₹28,250 likely**
🔻 **Invalidation above ₹30,500**
🚀 **Breakout or Reversal? Watch Price Action Carefully!**

ABBOTINDIA Breakout Daily TF - Set to reach new highs !!Abbott India has given a triangle pattern breakout, and with good Volumes.
ATH is the immediate target with the actual target being around 32100, as per the Triangle pattern breakout.
A retrace around the breakout zone is the possibility if the momentum mellows down.

ABBOTINDIA 1DAbbott India is experiencing a potential downside, with the price possibly reaching the ₹25,500 level
I'm not a SEBI-registered analyst. All posts and levels shared are just for educational purposes. I'm not responsible for any losses or profits. No claims, all rights reserved


AbbotInd 2022 to Nov 2024 in 2 years Unrealized return is +44% From Nov 2022 to Nov 2024 in 2 years
Unrealized return is +44% 61K/-
total investment 1.4 lac/-

Abbott India Poised for Upside: Targets ₹29,360Abbott India closed the week at ₹28,808, showing signs of strength as it approaches key upside targets of ₹29,360 and ₹29,800. With RSI above 50%, the stock is signaling increased bullish momentum, making it an attractive buy for the upcoming week. The stock has recently corrected over 10% during the previous downturn, creating an opportunity for a rebound. Investors looking for a return of over 3% may find this an ideal entry point.
The major support level is at ₹28,093, providing a solid foundation for any potential pullbacks. As long as the stock remains above this support and RSI continues to stay above 50, the bullish trend is expected to persist. This setup offers a favorable risk-reward ratio, making it a great opportunity for those looking to capitalize on Abbott India’s upside potential next week.

Abott india Abbot india formed round bottom
Lookin for 15 to 20% upside
SL around 29600
tarets are marked in pic
Its just view and not buy/sell advise

ABBOTT INDIA LTD S/R Support and Resistance Levels:
Support Levels: These are price points (green line/shade) where a downward trend may be halted due to a concentration of buying interest. Imagine them as a safety net where buyers step in, preventing further decline.
Resistance Levels: Conversely, resistance levels (red line/shade) are where upward trends might stall due to increased selling interest. They act like a ceiling where sellers come in to push prices down.
Breakouts:
Bullish Breakout: When the price moves above resistance, it often indicates strong buying interest and the potential for a continued uptrend. Traders may view this as a signal to buy or hold.
Bearish Breakout: When the price falls below support, it can signal strong selling interest and the potential for a continued downtrend. Traders might see this as a cue to sell or avoid buying.
20 EMA (Exponential Moving Average):
Above 20 EMA: If the stock price is above the 20 EMA, it suggests a potential uptrend or bullish momentum.
Below 20 EMA: If the stock price is below the 20 EMA, it indicates a potential downtrend or bearish momentum.
Trendline: A trendline is a straight line drawn on a chart to represent the general direction of a data point set.
Uptrend Line: Drawn by connecting the lows in an upward trend. Indicates that the price is moving higher over time. Acts as a support level, where prices tend to bounce upward.
Downtrend Line: Drawn by connecting the highs in a downward trend. Indicates that the price is moving lower over time. It acts as a resistance level, where prices tend to drop.
RSI: RSI readings greater than the 70 level are overbought territory, and RSI readings lower than the 30 level are considered oversold territory.
Combining RSI with Support and Resistance:
Support Level: This is a price level where a stock tends to find buying interest, preventing it from falling further. If RSI is showing an oversold condition (below 30) and the price is near or at a strong support level, it could be a good buy signal.
Resistance Level: This is a price level where a stock tends to find selling interest, preventing it from rising further. If RSI is showing an overbought condition (above 70) and the price is near or at a strong resistance level, it could be a signal to sell or short the asset.
Disclaimer:
I am not a SEBI registered. The information provided here is for learning purposes only and should not be interpreted as financial advice. Consider the broader market context and consult with a qualified financial advisor before making investment decisions.

Buy Abbott India Short Term Trading Advice by Goodluck Capital
Buy Abbott India
Buy Range- 27000 - 27500
Target- 29000 - 29500
StopLoss- below 26000
Potential Return- 6-8%
Approx trade duration 12 - 14 days

ABBOTINDIA LongABBOTINDIA Weekly strong support 24100
this is Weekly Strong Support
Expected Target 32000


Abbott India Ltd. (ABBOTIND) StrategyThe chart is a 4-hour candlestick chart of Abbott India Ltd. (ABBOTIND) on the NSE, with the current price at INR 26,196.20. The chart illustrates a symmetrical triangle pattern, highlighting key support and resistance levels and suggesting potential trade strategies based on price movements.
Key Observations:
1. Current Price and Trend:
- The current price is INR 26,196.20, reflecting an increase of 1.08%.
- The price is currently near the lower boundary of the symmetrical triangle.
2. Support and Resistance Levels:
- Immediate support is at INR 25,000.
- The next significant support level is at INR 23,591.
- Resistance levels include INR 26,700 and INR 27,100.
3. Symmetrical Triangle Pattern:
- The chart shows a symmetrical triangle pattern, indicating a potential breakout in either direction.
- Traders are watching for a breakout above the upper trendline or a breakdown below the lower trendline.
4. Trade Strategies:
- Buy Strategy:
- If the price breaks above INR 27,100, it signals a potential bullish breakout.
- Traders could buy at the breakout level or wait for a retracement and buy at INR 26,700.
- The target for this buy strategy is INR 28,700.
- Sell Strategy:
- If the price breaks below INR 25,000, it signals a potential bearish breakout.
- Traders could sell at the breakdown level or wait for a retracement and sell at INR 26,000.
- The target for this sell strategy is INR 23,600.
Summary:
The chart suggests a symmetrical triangle pattern for Abbott India Ltd., with the current price positioned near the lower boundary of the triangle. Key support is at INR 25,000, with further support at INR 23,591, while resistance levels are at INR 26,700 and INR 27,100. Traders are advised to watch for a breakout above INR 27,100 to initiate a buy with a target of INR 28,700 or a breakdown below INR 25,000 to initiate a sell with a target of INR 23,600. The decision to enter trades can also be based on waiting for retracement levels to ensure stronger confirmation of the breakout or breakdown.


Long AbbotindiaAs per price action formation has been made in 1 week TF.
Its a very big move.
Always check the sentiments of the market as per technical analysis, if the pattern get its respect.
Best of luck to all traders.
You are responsible for your Profits and loss, Shared for Educational purpose


ABBOTINDIA BREAKOUT TRADETrade: Entered ABBOTINDIA @25350 SL 22000 with half risk
Reason to Enter: Breakout from May 2021 to Jan 2024 consolidation range of 15600 –24600.
Defined SL 22000

Strong Brakeoutthe stock broke out very strong with huge volume and also had a follow up week with much higher volumes, The pharma index is also at an all-time high. let's see how the stock performs from here on.

ABBOTINDIA - AnalysisABBOTINDIA- Analysis
Chart Legend :-
...... - Dotted Green Line - Bullish make or break Level
..... - Dotted Green Line - Bearish make or break Level
..... - Dotted White Line - Major Levels
---- - Dash Green Line - Minor Target
---- - Dash red Line - Profit Booking or reversal and Stop loss
Line - green or red - Major levels
Safe Buy Above :- 23485
Risky Buy around - 22348
Stoploss - 21840
Few targets to Monitor
24100 , 24725, 25358, 25998 and 26647
Please comment if you wish to see my analysis for any stocks.
Please do your due diligence before trading or investment.
Thank you.

TRADE SETUP_WAVE V IN ABBOT_15-20% MOVEAbbott India Ltd. is seen coming out of a fourth wave triangle and is expected to have completed wave i of V.
The stock had remained in a 3month long correction during the fourth wave between Aug and Nov.
The stock is currently close to the support area of 23000 and is expected to settle and reverse from around here.
The final projected target for fifth wave completion comes in at around 27.5K-29K zone.
Note*-The views expressed are personal observations/opinions. Kindly do your own analysis before taking up any trading positions.

ABBOTINDIA ViewsThis script as shown in the chart drawing seems to be reacting well around the value area.
Adding it in our watch list for study purposes will be exciting, theme.
