ABBOTINDIA trade ideas

ABBOTTINDIATrendline breakout on weakly chart with strength and sustained above levels, short term targets 16700, 17300 with sl of 15600.
☠️☠️☠️
Above ideas are for educational purposes only, kindly consult your financial advisor before investing.
Please don’t forget to 👍 and subscribe if you like the idea.

Abbot Indiasome of the other companies making Liposomal Amphotericin B (curing drugs of black fungus) are Abbot India, Bharat Serum and Vaccines and Celon Labs.
Good entry level 15500 - 15800
SL 14500


ABBOT Weekly channel BreakoutThough this can be seen as a Bullish flag patter, am considering as a channel and set target as channel width.

#Abbott #AbbottIndiaWeekly breakout alert. Highly attractive risk to reward ratio.
Its my fundamental pick, available at good entry point. Keep adding whenever there is an opportunity. No SL, No Target for this one!

Can ABBOTT INDIA LTD reach 18K?On the weekly chart of ABBOTT INDIA LTD we can see Poll & Flag Pattern .Company has good fundamental.It is also well known company in pharma industry.This is an opportunity to buy the stock of ABBOTT INDIA for Investers(minimum 2 year).Chart pattern is also good,so Investers can buy this stock now.Levels and logic behind the trade marked on thhe chart.
Buy above-15400
Add more-14000
SL-12900
Target 1-17000
Target 2 -18500
Educational purpose only.
Consult your financial advisor before taking any action.

ABBOTINDIA LongABBOTINDIA As per educational purpose, here is a chart analysis for ABBOTINDIA where stock tends to have a huge upside if it breaks the triangle pattern with huge Volume, Correct me if I'm wrong


Long for a swing It not a recommendation but to share a thought as part of my study. Saw a morning star and a bullish engulfing that brack the resistance.


Abbott India major support breakdown today... lets see it is simply a shake out or it will go down more... next support and value area marked...
lets see price reaction of stock in those mention areas.. and act accordingly... long only if one see reversal confirmation candle patterns

Abbott India- FlagsPeople have written obituaries about this stock, as it is not moving since March 2020.
Stock has also closed below its 200 ema on a daily chart (which is generally considered bearish sign)
I may be wrong here, but what i see is stock is nicely moving in flag formation on a weekly chart. It is consolidating for now.
I will enter once that level breaks.

At Support AreaAbbott at weekly support Zone... one can go long if get reversal pattern in shorter time frame ... sl 14730

PRICE ACTION STRATEGYSee all my Publications if it seems to give you both knowledge and profit then only like subscribe and share to your near and dear.
thanks for my masters trading panthulu, day trader telugu, and nayan pokarkar.
These are all for educational purpose please consult your financial advisor before investing your hard earned money.

Abbot India seems good to investIt seems very good to invest would give 25% in return in 2 to 3 months or maybe soon than this ABBOT INDIA


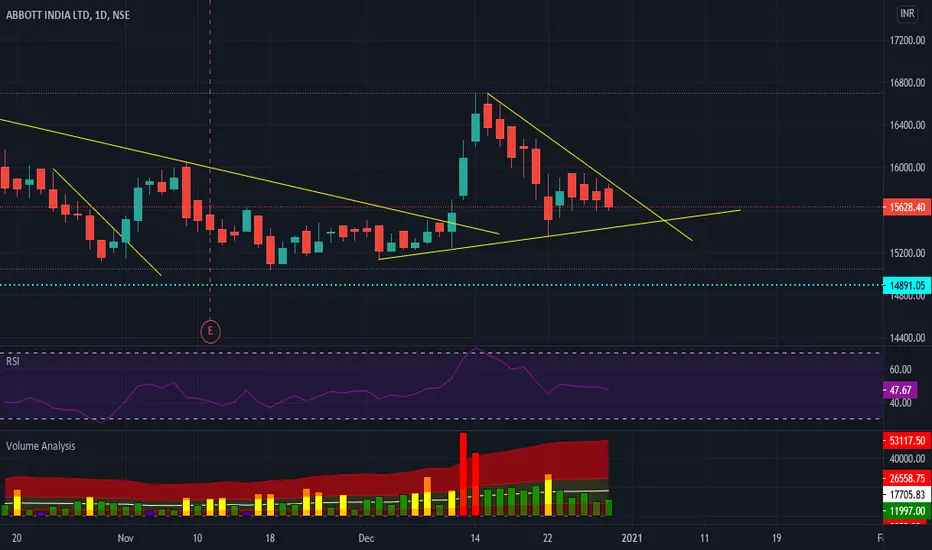
ABBOTINDIA - Breakout after consolidation - SwingThis analysis is done purely on basis of price action and chart patterns.
The analysis is done on weekly TF hence it can take couple of weeks to reach the target. But as the stock is in bullish trend on longer TF, it may reach target within few days as well.
Trade Logic, SL and Target is shown in image itself.
Daily TF chart is attached below for reference.
This analysis is for study purpose. Traders must do their own study before entering into any trade. Traders should trade with their own risk capacity and money management.
Feel Free to comment for any query or suggestion regarding this stock or Price Action Analysis

