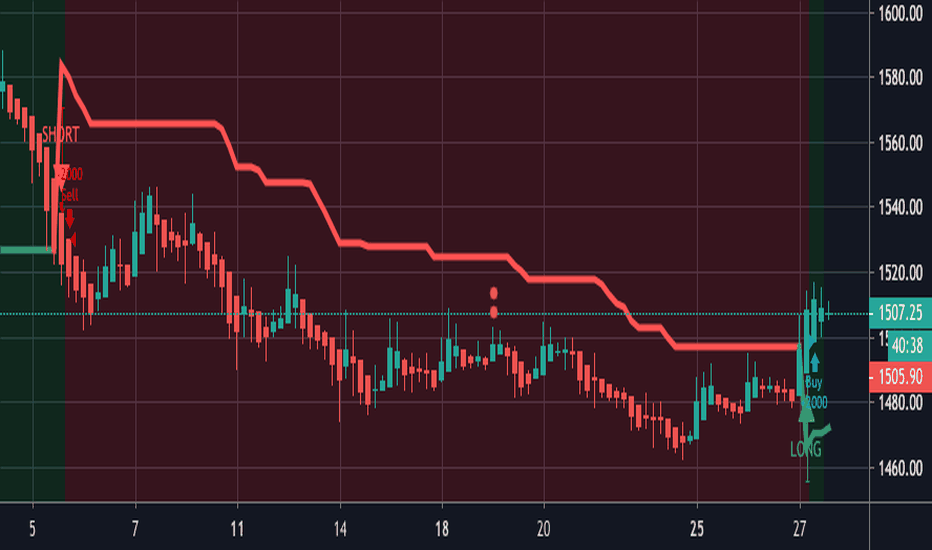
ACC trade ideas
ACC ON PRZ GO LONG WITH STRICT SL 1360As a trader you should consider your own risk:reward ratio and do proper lot sizing according to your margin and leverage level.
Not every idea is a valid trade.
This analysis is a trading idea, not a trading signal for you.
My own trend direction estimation, entry point, stop loss and take profit levels are on the chart.
Good Lucks.
Weekly Chart of ACCAs seen from the Weekly Chart of ACC, the stock is trading near to trend-line support on downside. On monthly chart the stock is trading in triangle pattern since since Sept-2017. On daily chart the stock is consolidating in 40 Rs. range. If the stock manages to close above 1470, the stock can see further uptrend. If the stock holds the support zone then the stock can move to the levels of 1650-1700 in 3-4 months time frame. Uptrend view is negated below the levels of 1400 on closing basis.


