Adani eneterprises 15 Min chart (performing symentrical triangleAdani Enterprises 15 min chart is performing the symentrical chart pattern(let see which side breakout will come out.
ADANIENT trade ideas

Adani ENTPJust an example to support my understanding about the long-term investing, based on indicator-based theme of investing.

Profit Booking to start in Adani Ent.
Adani ent. seem to be at the current swing high. I think profit should be booked at this level. Or at least half of the stocks should be released, and stay with rest half.

ADANIENT--Bullish or Bearish??Observations::
Drop base drop is observed
now stock price @ base, but no sign of bearishness...
after showing bearish again consolidation...
may again goes bullish or reversal we have to wait for confirmation.
If base acts as resistance price again falls.
we have demand zone @ bottom price will test that zone but not immediately...slow process is going to observe. keep an alert @ demand then go for long.
after strong breakout, price again ranging may again continue its bullishness....
so don't go for short without any proper confirmation.
if again showing bullishness, we wait if price again breaks 3075 level, and not able to sustain above then look for sell.

Adani ENTPAfter all what is analysis to me, it's a ego satisfaction, to some deep level.
Market moves, on its own merits, and I can't pinpoint it on my merits.
But, there are moments of celebration, which we must cherish.

ADANIENT trendline breakout Took a long position in Adanient as trendline gave breakout on upper side. SL Buy order was set 2200 and it gone up to 2759 in 2 days.

NIFTY morning view bearish 100000%Can take pe in morning but evening session is risky to hold pe. If whole day nifty fall then tomorrow also it will be bearish. Be careful today eve may reverse from down side.

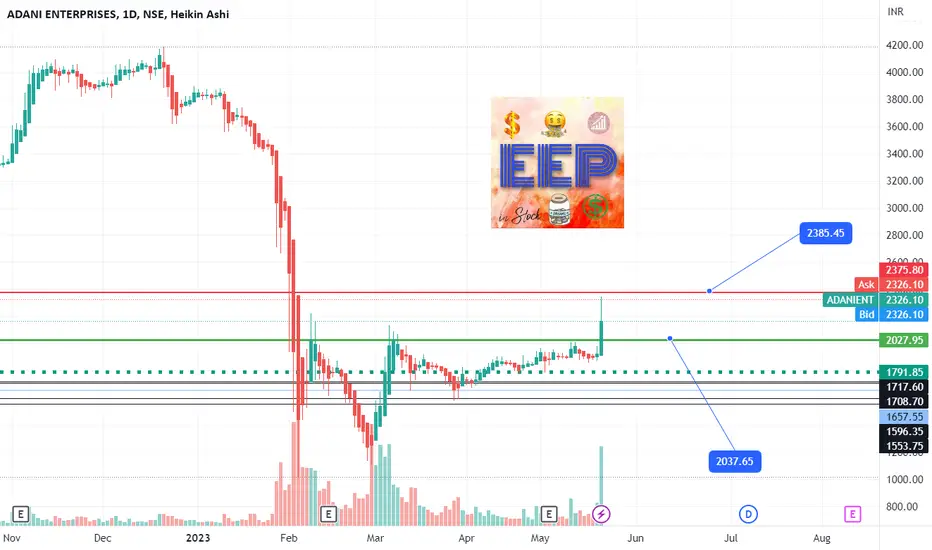
ADANIENT Long Term View ENTRY IS GIVEN AT 2140
STOPLOSS IS AT 1820
TARGET IS 3900
Double Bottom Pattern
This View is purely based on Technical Analysis and is for educational purposes only.

new views for ADANI ENTPAs discussed in the earlier analysis, I was biased towards long side in this script. Now, since it has travelled a great distance, near term hurdles are shown in the chart drawing.

Adani EnterprisesAdani Seth has won.
India has won
Markets speak with their Gold Coins.
And Market has spoken.
Target Rs 5500, post elections !!

Adanientdt 19-5-2023
adanient cmp 1956.05
near trandline breakout
just wait and watch reinvestment lavel

ADANIENT-- Rise or fall ??Observations::
-------->> the stock is trending upwards.
-------->> now price is at the zone where a strong sell off happens previously, may price again fall from this zone.
-------->> careful at this zone before going long.
--------->> we have a trendline support as well. keep track this level for further movement in the stock.
Note::
Keep on sell side from this zone. A strong sell off is going to observe.

2222 is ComingPrice is in the accumulation phase of the Market maker buy model, Specifically, this is a second level of accumulation, I am expecting a displacement towards the Draw on Liquidity as we spent lot of time in the zone


ADANI ENT - LONG ANALYSISProvided if the Stock breaks the level of trendline in upcoming Trading Session, there is a chance for going long for Swing Trade. There is good volume coming up in last few days. There has been some positive news in Adani Ent .
If the price breaks above the level and then retests the levels and moves in a up direction we can have a swing trade in Adani Ent.
I will keep updating regarding this idea in next few days.

Adani Enterprise NSE:ADANIENT had formed a symmetrical chart pattern in 1 day timeframe. And had been consolidating from couple of months. currently its is nuetral. Waiting for a clear breakout.
If it's gives breakout in upward direction. Then take a long position.
first target Rs 2065
second target Rs 2368
If it's gives breakout in downward dorection. Then take a short position.
first target Rs 1552
second target Rs 1240
And stoploss is must.

Adani enterprises Adani enterprises break resistance of 1900 and next resistance shows at 2000 level as per open interest.
It moves upto 2000 to 2100 in short time

Adani E- Squeeze in Price and volume - Price volume volatility has squeeze. A break out either side would lead to a massive move. On the down side the Mother candle, "The Noisy candle of 6 February that led to the massive fall" still not taken out. Triangle pattern correction towards low side indicate that down trend may continue. A price volume squeeze indicate that that a big move is about to take place and could be a trend change. A break out of price below 1600 would indicate a new low. A break out on the upside of the channel would indicate price of 2200 level and beyond. For the upside since the volatility has squeezed, can be sign of a trend change. For the upside would suggest to have a close watch on volume. Suggestions are welcome.

FRESH LONG BEFORE 2160 WOULD BE A DISASTERThis is my take on Adani E. The script never got corrected since April 2020 and was always in uptrend. The fall in the month of January is the first correction of Wave 1 on weekly chart. The correction was sharp and fearful and upto 78.6% retracement. In case if the trend is to reverse and Wave 3 is to start it would be confirmed only on the closure on weekly basis above 2160 level. In case if in the near term the price gets rejected at 2000 level further pain may continue. The chart is also an inside candle pattern on weekly chart indicating the downtrend continues.
The new long can be entered only at the break out above 2160 level.
Building long position before 2160 level break could be a disaster. The low side could be 400 and below.

Adani enterprises ADANIENT on the daily chart has witnessed a triangle pattern breakout and prices are trading above the resistance zone.
Stock is trading above its 9 & 21 EMA and momentum oscillator RSI (14) has witnessed a range breakout above 50 levels with bullish crossover.
This bullish pattern will be neglected If prices closed below the 1800 levels

Adani Entprise half rules uptrend downtrendHi every one adani enterprise rules
Adani enterprise ka share kab buy banta hai
kab sale
dekho

Adani Enterprise target and entryHi Everyone
My overview of adani enterprise
you can trade if you get opportunity
adani ki tarah facebook and microsoft ke share bhi correct huve the ok
