AFFLE💼 Trade Plan - Buy Setup
Parameter Value
Entry 1829
Stop Loss (SL) 1730
Target 2542
Risk 99 pts
Reward 713 pts
Risk:Reward Ratio (RR) 7.2 (Excellent)
📊 Support/Resistance Reference Points
Metric Value
Last High 1884
Last Low 1226
Point Var 658
🟡 Entry (1829) is near strong weekly/daily/60M demand zones, providing a good base for support.
✅ Conclusion / Recommendation
Trend Bias: Strongly bullish across all timeframes.
Technical Setup: Clean demand zone alignment and clear RBR/BUFL/DMIP logic.
Trade Setup: Excellent RR of 7.2 with defined risk at 1730 and upside till 2542.
Viability: High-probability long trade setup as long as price stays above 1730.
🔍 Trend & Demand Zone Overview
Timeframe Trend Proximal Distal Avg Demand Zone
HTF (High TF) UP 1,433 1,061 1,247
MTF (Mid TF) UP 1,819 1,768 1,794
ITF (Intraday TF) UP 1,817 1,783 1,800
✅ All timeframes show UPTREND, reinforcing bullish strength.
🧠 Technical Logic & Observations
HTF Analysis: Based on "Rally-Base-Rally" structures.
MTF & ITF Zones: Use BUFL (Base Upon Fresh Level) and DMIP (Drop-Base-Move in Price) formations, both of which are bullish demand setups.
AFFLE trade ideas
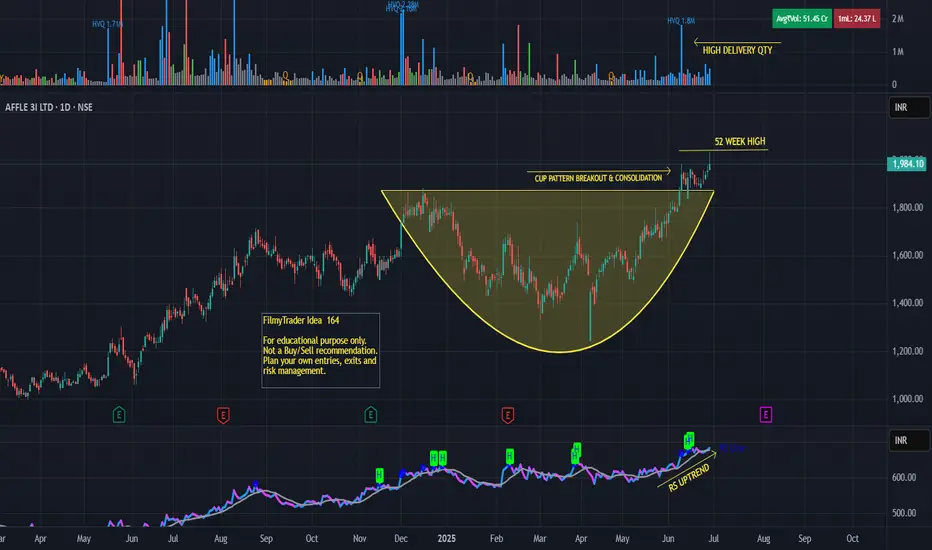
Affle - Cup Pattern BreakoutAffle 3i Ltd.
Cup pattern breakout and consolidating in daily time frame.
High delivery quantity this month.
Close within 52 week zone.
Stocks crossed its previous week high.
Stocks RSI crossed above 70.
Disclaimer:
For educational purpose only.
Please do your own research before taking any trades.
Happy Trading!
AffleAffle
MTF Analysis Remarks
AffleYearly Demand 815
Affle 6 Month Demand 1,394
Affle Qtrly Demand 1,260 Breakout
AffleMonthly resistnce Now support 1,394
AffleWeekly Demand DMIP 1,336 BUY
Affle Daily resistnce Now support 1,415 BUY
Once Daily Closing above 1690 - Expecting 2500 Target will Hit in Few Weeks
ENTRY -1 Long 1,415
SL 1,300
RISK 115
Target as per Entry 2,508
RR 10
Last High 1,884
Last Low 1,260

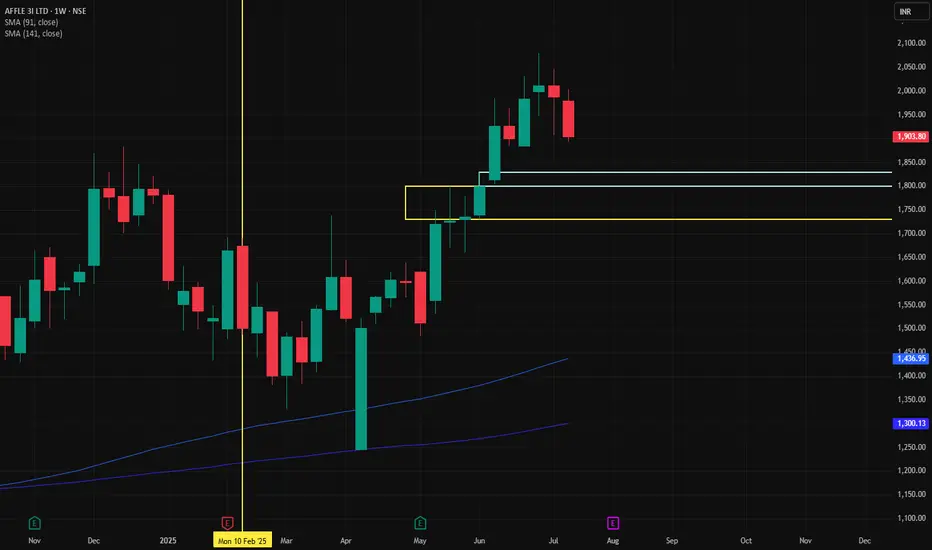
Flag Pattern. after end of the 2 years uptrend got, 2 Year range consolidation.
and breakout with tighter consolidation 1 month. its shows the Good Trend breakout.

AFFLE | SWING | POSITIONAL | LONGOne of the few Nifty 500 stocks which is showing Bullish price action is AFFLE. The stock is consistently forming Higher Lows and is now perfectly poised to breach new levels.
Notice how the price is trading comfortably above the Monthly Pivot which indicates Bulls are in control.
I've taken a long position in the stock for a Target to 2100 price level.

AFFLE NSE:AFFLE
IT Sector
Added #AFFLE to my watchlist a month ago, and it's still there, shining bright.
Affle's innovative approach in mobile marketing is something to watch closely
Gap filling done on a weak market
Showing solid strength
Clearly bullish on this stock

is AFFLE ready to move?this will complete symmetrical triangle pattern and once breakout, it will fly
Targets possible:
1360-1490-1590-1690-1780
Disclaimer:- Please always consult with your financial advisor or do your analysis before taking trade

AFFLE (INDIA) LTD S/R Support and Resistance Levels:
Support Levels: These are price points (green line/shade) where a downward trend may be halted due to a concentration of buying interest. Imagine them as a safety net where buyers step in, preventing further decline.
Resistance Levels: Conversely, resistance levels (red line/shade) are where upward trends might stall due to increased selling interest. They act like a ceiling where sellers come in to push prices down.
Breakouts:
Bullish Breakout: When the price moves above resistance, it often indicates strong buying interest and the potential for a continued uptrend. Traders may view this as a signal to buy or hold.
Bearish Breakout: When the price falls below support, it can signal strong selling interest and the potential for a continued downtrend. Traders might see this as a cue to sell or avoid buying.
20 EMA (Exponential Moving Average):
Above 20 EMA(50 EMA): If the stock price is above the 20 EMA, it suggests a potential uptrend or bullish momentum.
Below 20 EMA: If the stock price is below the 20 EMA, it indicates a potential downtrend or bearish momentum.
Trendline: A trendline is a straight line drawn on a chart to represent the general direction of a data point set.
Uptrend Line: Drawn by connecting the lows in an upward trend. Indicates that the price is moving higher over time. Acts as a support level, where prices tend to bounce upward.
Downtrend Line: Drawn by connecting the highs in a downward trend. Indicates that the price is moving lower over time. It acts as a resistance level, where prices tend to drop.
RSI: RSI readings greater than the 70 level are overbought territory, and RSI readings lower than the 30 level are considered oversold territory.
Combining RSI with Support and Resistance:
Support Level: This is a price level where a stock tends to find buying interest, preventing it from falling further. If RSI is showing an oversold condition (below 30) and the price is near or at a strong support level, it could be a good buy signal.
Resistance Level: This is a price level where a stock tends to find selling interest, preventing it from rising further. If RSI is showing an overbought condition (above 70) and the price is near or at a strong resistance level, it could be a signal to sell or short the asset.
Disclaimer:
I am not a SEBI registered. The information provided here is for learning purposes only and should not be interpreted as financial advice. Consider the broader market context and consult with a qualified financial advisor before making investment decisions.

Affle IndiaAre you expecting more of Downside ??
Is 1480 Protected ??
Or 2000 is waiting ??
No Recommendations. Just watch it.

affle india longaffle india long weekly demand : 1560
affle india long Daily demand : 1529
target 1950

AFFLE INDIA LONG: HTF Demand Zone
Price is coming from Weekly Demand Zone & Month Demand Breakout
Affle Monthly Demand 1394 -Monthly BUFL PAT
Affle Weekly Demand 1496 -Weekly BUFL PAT
Affle Daily DMIP Demand 1648-1625 -Daily DMIP BUFL PAT
Affle 60 Mins BUFL Demand 1610 -60 Mins BUFL BUFL PAT
Fresh Target 1870

$AFFLEdecent stock to have if you want organic growth
comign to take liquidity below previous range high then continue up imho

Affle India-Nice BreakoutAffle India-Nice Breakout
Capital to be deployed -20k
Investing Price -1560-1580
Breakout Price -1560
Stoploss -1348
Targets -2000
#affle #StockMarketindia #StockToWatch #StocksInFocus #stockstowatch #StocksToTrade

solidTomorrow's market prediction is very difficult, but this stock can be strong
no recommendation for bu and sell
life time high solid accumulation at any lower level
volume aslo massive supporting to stock sustain in bearish market
best option in this stock

Afffle India-Breakout Of Inverted H&S PatternThe inverse head and shoulders chart pattern is a bullish chart formation that signals a potential reversal of a downtrend.

Long term continuation biasing patternGood volume buildup in daily and weekly timeframe.
Highest volume buildup in daily timeframe.
Long-term continuation biasing pattern breakout with good volume.
Fundamentals are good.
FII and DII stake increased significantly.
NOTE: I do my analysis, do yours before trade.

AFFLE1. Anything can happen.
2. You don't need to know what is going to happen next in order to make money.
3. There is a random distribution between wins and losses for any given set of variables that define an edge. No other thoughts
4. An edge is nothing more than an indication of a higher probability of one thing happening over another.
5. Every moment in the market is unique.

Affle good setup!Typical cup & handle pattern BO
Good earnings report
sector performing good
Targets are given
stop loss on trader's discretion .

SWING IDEA - AFFLE (INDIA) LTDAffle India , a global technology company specializing in mobile advertising, is showing technical patterns that suggest a potential swing trading opportunity.
Reasons are listed below :
Ascending Triangle Pattern : The stock is forming an ascending triangle pattern, a bullish continuation pattern that indicates increasing demand and the potential for an upward breakout.
Repeated Resistance Testing (1250-1300) : The 1250-1300 resistance zone has been tested multiple times. The stock is now poised to potentially break through this level, indicating strong bullish momentum.
Bullish Marubozu Candle : The recent formation of a bullish marubozu candle suggests strong buying pressure and the potential for further upward movement.
Trading Above 50 and 200 EMA : Affle India is trading above both the 50-day and 200-day exponential moving averages, indicating a strong uptrend and providing robust support levels.
Consistently Making Higher Highs : The stock is consistently making higher highs, indicating a sustained uptrend and ongoing bullish sentiment.
Target - 1500 // 1880
Stoploss - weekly close below 1050
DISCLAIMER -
Decisions to buy, sell, hold or trade in securities, commodities and other investments involve risk and are best made based on the advice of qualified financial professionals. Any trading in securities or other investments involves a risk of substantial losses. The practice of "Day Trading" involves particularly high risks and can cause you to lose substantial sums of money. Before undertaking any trading program, you should consult a qualified financial professional. Please consider carefully whether such trading is suitable for you in light of your financial condition and ability to bear financial risks. Under no circumstances shall we be liable for any loss or damage you or anyone else incurs as a result of any trading or investment activity that you or anyone else engages in based on any information or material you receive through TradingView or our services.
@visionary.growth.insights

Head & Shoulder Pattern breakout On Affle indiaAfter 2.5 Year of consolidation Affle india give breakout above neck line,One can hold for a target of 1511 & 1809 respectively ,with a stoploss of 1330

Break out from ressistance AffleBroke previous resistance with volume can go up to 1445, 1500 buy on dip with sl below 1200 on daily closing, duration of holding few weeks.
RSI now at 70, add more qty on dip.
Share Khan given target of 1535 on May 2024 , from entry of 1200 levels
Summary of Sharekhan Report
Affle’s (India) Q4FY24 revenue stood at Rs. 506.2 crore up, 1.5% q-o-q/42.3% y-o-y, beating our estimates of Rs.
499.8 crore, driven by steady growth in CPCU revenue.
EBITDA margin was flat at 19.4%, on q-o-q and y-o-y basis, slightly beating our estimate of 19.2%. CPCU revenue
recorded steady growth at Rs. 503.8 crore, up 5.5% q-o-q/57.8% y-o-y. Converted users grew 5.5% q-o-q/41.7%
y-o-y to Rs. 8.8 crore.
The company is poised to further accelerate its growth trajectory in FY2025 with a gradual increase in profitability
margin. The company is experiencing a strong market opportunity as advertisers are consistently increasing
their digital spending.
We maintain BUY on Affle with an unchanged PT of Rs. 1,535, as the company is expected to accelerate the
growth trajectory, driven by a wider adoption of its CPCU model and increased digital spending by advertisers.
At 1228 INR the stock trades at 43/36.1x its FY25/FY26E EPS.
www.tradingview.com
For educational Purpose. Consult your fiancial advisor before investing.

Breakout almost there a breakout into a round bottom has been expected for a long-time volume is also volume building up, it is possible happens then it will be very big

Affle India (Study Purpose)At support 200DMA, Volatility is lesser compare to other stocks.
Perfect reversal can happen from here.
Disclaimer : Above scenario just for educational purpose and study of graphical movements as per available technical parameters derived by professionals. Be careful before investing and consult your advisor before making such decisions. I am not responsible for any mishaps or losses or gains. Not a registered sebi member.
Personally I'm not invested yet.
