AgarInd Swing TradeEntry
T1 - 1830/- (Time Frame - 4 to 8 weeks)
T2 - 2790/- (Time Frame - 12 Months)
Next report date
—
Report period
—
EPS estimate
—
Revenue estimate
—
77.35 INR
1.16 B INR
23.99 B INR
4.89 M
About AGARWAL INDS CORP LTD.
Sector
Industry
CEO
Jai Prakash Agarwal
Website
Headquarters
Mumbai
Founded
1995
ISIN
INE204E01012
FIGI
BBG000C3M9N0
Agarwal Industrial Corp. Ltd. engages in the manufacture and trade of petrochemicals in India. It operates through the following segments: Ancillary Infra, Logistics, Windmill, and Other. The Ancillary Infra segment manufactures and trades Bitumen and Allied products. The Logistics segment transports Bitumen and Liquefied Petroleum Gas (LPG). The Windmill segment focuses on energy generation. The company was founded on January 13, 1995 and is headquartered in Mumbai, India.
Related stocks

AGARIND: A Promising Petrochemicals Player with Robust FinancialAgarwal Industrial Corporation Ltd (AGARIND) is a diversified industrial conglomerate primarily engaged in the manufacturing and trading of petrochemicals, logistics of bitumen and liquefied Petroleum Gas, and energy generation through Wind Mills. Let's dive into the company's financial performance


Agarwal Industrial - Analysis Buy zone above 945 to 970
Expected Major targets - 1200 if sustain above then 1510
Minor targets - 1100, 1240 , 1380, 1460
Stop loss - Closing below - 940 for risky trader 850
Please do your due diligence before trading or investment.
*Comment or message me if you wish to see my analysis for

Agarwal IndustrialAgarwal Industrial Corporation Ltd is primarily engaged in the business activities of manufacturing and trading of Petrochemicals (Bitumen and Bituminous Products), logistics of bitumen and liquefied Petroleum Gas and energy generation through Wind Mills

AGARINDThese are swing ideas which you can add your watchlist and analysis for yourself !
Keep on your radar!
This I am not sebi ragister I

Triangle Pattern BreakoutPlease look into the chart for a detailed understanding.
Consider these for short-term & swing trades with 2% profit.
For BTST trades consider booking
target for 1% - 2%
For long-term trades look out for resistance drawn above closing.
Please consider these ideas for educational purpose

Agarwal Ind looks goodAgarwal Industries looks strong.
I missed entry into it, and hence will wait for a good entry point.
This stock is good for long term as portfolio as well.
Life time High Look at chart life time High lower high breakout getting towards new high
No recommendation for buy and sell

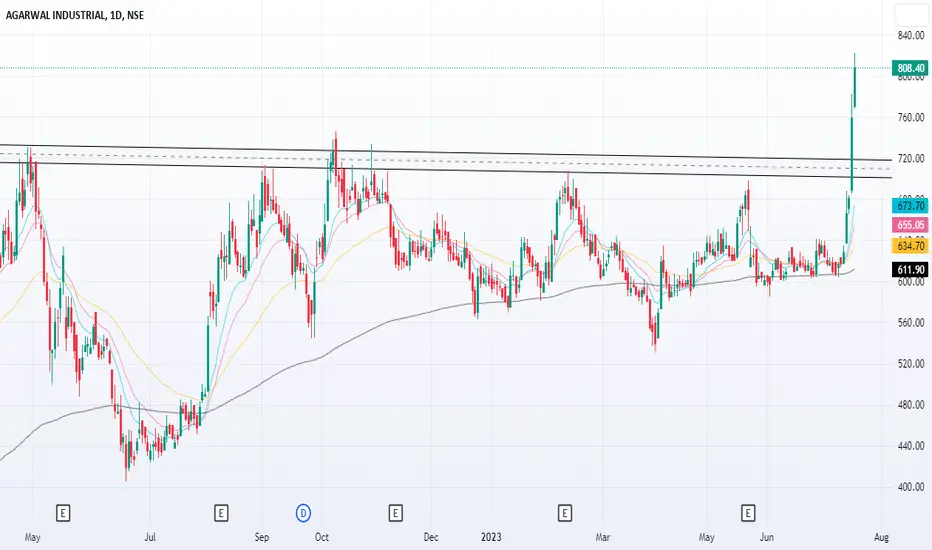
Agarwal Industrial Corp- Nice BreakoutAgarwal Industrial Corp- Nice Breakout
Capital to be deployed- 20k
Investing Price -800-805
Breakout Price -794
Stoploss -696
Targets -1145
#agarwalind #StockMarketindia #StockToWatch #StocksInFocus #stockstowatch #StocksToTrade

See all ideas
Summarizing what the indicators are suggesting.
Oscillators
Neutral
SellBuy
Strong sellStrong buy
Strong sellSellNeutralBuyStrong buy
Oscillators
Neutral
SellBuy
Strong sellStrong buy
Strong sellSellNeutralBuyStrong buy
Summary
Neutral
SellBuy
Strong sellStrong buy
Strong sellSellNeutralBuyStrong buy
Summary
Neutral
SellBuy
Strong sellStrong buy
Strong sellSellNeutralBuyStrong buy
Summary
Neutral
SellBuy
Strong sellStrong buy
Strong sellSellNeutralBuyStrong buy
Moving Averages
Neutral
SellBuy
Strong sellStrong buy
Strong sellSellNeutralBuyStrong buy
Moving Averages
Neutral
SellBuy
Strong sellStrong buy
Strong sellSellNeutralBuyStrong buy
Displays a symbol's price movements over previous years to identify recurring trends.
Frequently Asked Questions
The current price of AGARIND is 965.05 INR — it has decreased by −2.01% in the past 24 hours. Watch AGARWAL INDS CORP LTD. stock price performance more closely on the chart.
Depending on the exchange, the stock ticker may vary. For instance, on NSE exchange AGARWAL INDS CORP LTD. stocks are traded under the ticker AGARIND.
AGARIND stock has risen by 0.20% compared to the previous week, the month change is a −1.69% fall, over the last year AGARWAL INDS CORP LTD. has showed a −19.58% decrease.
AGARIND reached its all-time high on Dec 20, 2024 with the price of 1,380.00 INR, and its all-time low was 43.95 INR and was reached on Mar 31, 2020. View more price dynamics on AGARIND chart.
See other stocks reaching their highest and lowest prices.
See other stocks reaching their highest and lowest prices.
AGARIND stock is 3.23% volatile and has beta coefficient of 1.14. Track AGARWAL INDS CORP LTD. stock price on the chart and check out the list of the most volatile stocks — is AGARWAL INDS CORP LTD. there?
Today AGARWAL INDS CORP LTD. has the market capitalization of 14.43 B, it has increased by 0.19% over the last week.
Yes, you can track AGARWAL INDS CORP LTD. financials in yearly and quarterly reports right on TradingView.
AGARWAL INDS CORP LTD. is going to release the next earnings report on Aug 6, 2025. Keep track of upcoming events with our Earnings Calendar.
AGARIND net income for the last quarter is 305.38 M INR, while the quarter before that showed 277.03 M INR of net income which accounts for 10.23% change. Track more AGARWAL INDS CORP LTD. financial stats to get the full picture.
Yes, AGARIND dividends are paid annually. The last dividend per share was 3.00 INR. As of today, Dividend Yield (TTM)% is 0.31%. Tracking AGARWAL INDS CORP LTD. dividends might help you take more informed decisions.
EBITDA measures a company's operating performance, its growth signifies an improvement in the efficiency of a company. AGARWAL INDS CORP LTD. EBITDA is 2.02 B INR, and current EBITDA margin is 8.43%. See more stats in AGARWAL INDS CORP LTD. financial statements.
Like other stocks, AGARIND shares are traded on stock exchanges, e.g. Nasdaq, Nyse, Euronext, and the easiest way to buy them is through an online stock broker. To do this, you need to open an account and follow a broker's procedures, then start trading. You can trade AGARWAL INDS CORP LTD. stock right from TradingView charts — choose your broker and connect to your account.
Investing in stocks requires a comprehensive research: you should carefully study all the available data, e.g. company's financials, related news, and its technical analysis. So AGARWAL INDS CORP LTD. technincal analysis shows the neutral today, and its 1 week rating is sell. Since market conditions are prone to changes, it's worth looking a bit further into the future — according to the 1 month rating AGARWAL INDS CORP LTD. stock shows the buy signal. See more of AGARWAL INDS CORP LTD. technicals for a more comprehensive analysis.
If you're still not sure, try looking for inspiration in our curated watchlists.
If you're still not sure, try looking for inspiration in our curated watchlists.