Akshar Chemicals-Nice BreakoutAkshar Chemicals-Nice Breakout
Capital to be deployed -20k
Investing Price -364
Breakout Price -364
Stoploss -309
Targets -477-567-674
#aksharchem #StockMarketindia #StockToWatch #StocksInFocus #stockstowatch #StocksToTrade
5.95 INR
47.70 M INR
3.46 B INR
7.87 M
About AKSHARCHEM INDIA LTD
Sector
Industry
CEO
Munjal Mrugesh Jaykrishna
Website
Headquarters
Bodakdev
Founded
1989
ISIN
INE542B01011
FIGI
BBG000C3G323
AksharChem (India) Ltd. engages in the manufacture and export of dyes and pigments. It specializes in producing vinyl sulphone and CPC green which have applications in textiles, inks, rubber, plastics, paints and leather industries. The company was founded on July 4, 1989 and is headquartered in Mehsana, India.
Related stocks

Biased on chart pattern This is my first post. I'm posting this for my self-learning.
I found that the stock is near the support and resistance. and also a triangle pattern formed in the chart so according to my point of view. for the short term, I can take a long position.


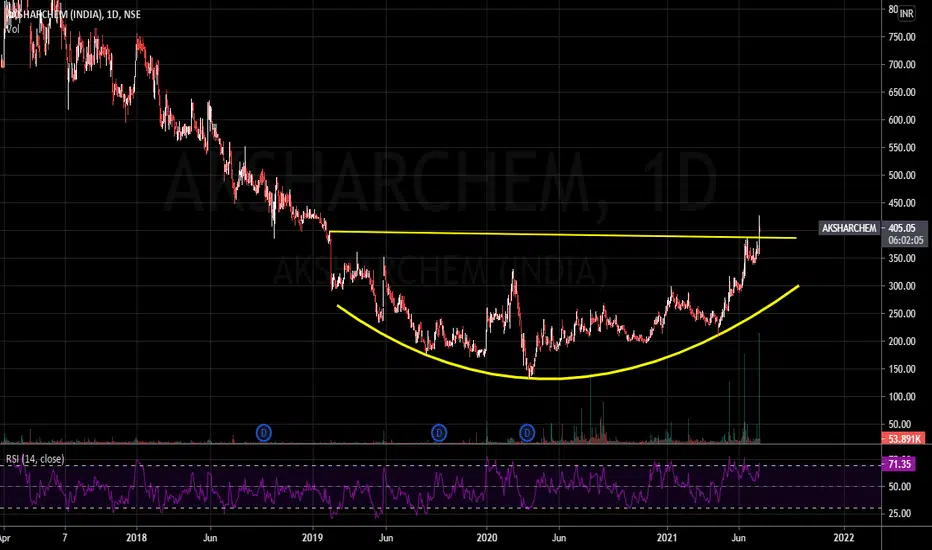
Big Rounding Bottom on Daily ChartAKSHARCHEM
Bullish above 410
Target : 444, 500
SL: 380 close base
time frame 1 month
Risk is yours and reward is too yours totally
big rounding bottom pattern in daily chart and we can say it is reversal sign from bottom levels, As per valuation, It is under 500 attractive.

weekly and daily bullish forming rounding bottom in weekly
volumes rising
trend tuned
seen accumulation while forming rounding bottom
small and mid caps are performing .

aksharchemAksharchem after long time breakout seen.
in current scenario Chemical Sector in lime light.
add this stock cmp and near365
we seen demand up to 461/515/ 608+
view invalid below 287 wcb


AKSHERCHEM CMP.301.60ASKHERCHEM AFTER MAKING LOWER LOWS NOW THE TREND CHANGED TO HH HL ON WEEKLY CHARTS . SMART ACCUMULATION COMPLETED AND READY TO MOVE UPSIDE ACCORDING TO PRICE VOLUME TREND ANALYSIS. KEEP ON EYE FOR LONG SIDE.

See all ideas
Summarizing what the indicators are suggesting.
Oscillators
Neutral
SellBuy
Strong sellStrong buy
Strong sellSellNeutralBuyStrong buy
Oscillators
Neutral
SellBuy
Strong sellStrong buy
Strong sellSellNeutralBuyStrong buy
Summary
Neutral
SellBuy
Strong sellStrong buy
Strong sellSellNeutralBuyStrong buy
Summary
Neutral
SellBuy
Strong sellStrong buy
Strong sellSellNeutralBuyStrong buy
Summary
Neutral
SellBuy
Strong sellStrong buy
Strong sellSellNeutralBuyStrong buy
Moving Averages
Neutral
SellBuy
Strong sellStrong buy
Strong sellSellNeutralBuyStrong buy
Moving Averages
Neutral
SellBuy
Strong sellStrong buy
Strong sellSellNeutralBuyStrong buy
Displays a symbol's price movements over previous years to identify recurring trends.
Frequently Asked Questions
The current price of AKSHARCHEM is 311.40 INR — it has increased by 2.12% in the past 24 hours. Watch AKSHARCHEM INDIA LTD stock price performance more closely on the chart.
Depending on the exchange, the stock ticker may vary. For instance, on NSE exchange AKSHARCHEM INDIA LTD stocks are traded under the ticker AKSHARCHEM.
AKSHARCHEM stock has risen by 0.11% compared to the previous week, the month change is a 23.96% rise, over the last year AKSHARCHEM INDIA LTD has showed a 0.05% increase.
AKSHARCHEM reached its all-time high on May 15, 2017 with the price of 945.00 INR, and its all-time low was 134.00 INR and was reached on Mar 24, 2020. View more price dynamics on AKSHARCHEM chart.
See other stocks reaching their highest and lowest prices.
See other stocks reaching their highest and lowest prices.
AKSHARCHEM stock is 5.00% volatile and has beta coefficient of 0.89. Track AKSHARCHEM INDIA LTD stock price on the chart and check out the list of the most volatile stocks — is AKSHARCHEM INDIA LTD there?
Today AKSHARCHEM INDIA LTD has the market capitalization of 2.48 B, it has decreased by −1.74% over the last week.
Yes, you can track AKSHARCHEM INDIA LTD financials in yearly and quarterly reports right on TradingView.
AKSHARCHEM net income for the last quarter is 7.11 M INR, while the quarter before that showed 13.87 M INR of net income which accounts for −48.74% change. Track more AKSHARCHEM INDIA LTD financial stats to get the full picture.
Yes, AKSHARCHEM dividends are paid annually. The last dividend per share was 0.50 INR. As of today, Dividend Yield (TTM)% is 0.16%. Tracking AKSHARCHEM INDIA LTD dividends might help you take more informed decisions.
EBITDA measures a company's operating performance, its growth signifies an improvement in the efficiency of a company. AKSHARCHEM INDIA LTD EBITDA is 250.13 M INR, and current EBITDA margin is 7.17%. See more stats in AKSHARCHEM INDIA LTD financial statements.
Like other stocks, AKSHARCHEM shares are traded on stock exchanges, e.g. Nasdaq, Nyse, Euronext, and the easiest way to buy them is through an online stock broker. To do this, you need to open an account and follow a broker's procedures, then start trading. You can trade AKSHARCHEM INDIA LTD stock right from TradingView charts — choose your broker and connect to your account.
Investing in stocks requires a comprehensive research: you should carefully study all the available data, e.g. company's financials, related news, and its technical analysis. So AKSHARCHEM INDIA LTD technincal analysis shows the strong buy rating today, and its 1 week rating is buy. Since market conditions are prone to changes, it's worth looking a bit further into the future — according to the 1 month rating AKSHARCHEM INDIA LTD stock shows the buy signal. See more of AKSHARCHEM INDIA LTD technicals for a more comprehensive analysis.
If you're still not sure, try looking for inspiration in our curated watchlists.
If you're still not sure, try looking for inspiration in our curated watchlists.