$AKUMrun it back turbo from here pls
who ever is loading up and trying to shake people out
good job
lets flip range high from here and start the fun
still got a long term outlook no rush just gutted added a bit too early again
AKUMS trade ideas
AKUMS DRUGS AND PHARMA LTD S/RSupport and Resistance Levels:
Support Levels: These are price points (green line/shade) where a downward trend may be halted due to a concentration of buying interest. Imagine them as a safety net where buyers step in, preventing further decline.
Resistance Levels: Conversely, resistance levels (red line/shade) are where upward trends might stall due to increased selling interest. They act like a ceiling where sellers come in to push prices down.
Breakouts:
Bullish Breakout: When the price moves above resistance, it often indicates strong buying interest and the potential for a continued uptrend. Traders may view this as a signal to buy or hold.
Bearish Breakout: When the price falls below support, it can signal strong selling interest and the potential for a continued downtrend. Traders might see this as a cue to sell or avoid buying.
MA Ribbon (EMA 20, EMA 50, EMA 100, EMA 200) :
Above EMA: If the stock price is above the EMA, it suggests a potential uptrend or bullish momentum.
Below EMA: If the stock price is below the EMA, it indicates a potential downtrend or bearish momentum.
Trendline: A trendline is a straight line drawn on a chart to represent the general direction of a data point set.
Uptrend Line: Drawn by connecting the lows in an upward trend. Indicates that the price is moving higher over time. Acts as a support level, where prices tend to bounce upward.
Downtrend Line: Drawn by connecting the highs in a downward trend. Indicates that the price is moving lower over time. It acts as a resistance level, where prices tend to drop.
Disclaimer:
I am not a SEBI registered. The information provided here is for learning purposes only and should not be interpreted as financial advice. Consider the broader market context and consult with a qualified financial advisor before making investment decisions.

$akum drugs and pharmasorry but i have sinned swapped my jio F for this for now
trying to be greedy and to be honest not worried with it long term so for now waiting on some volume to kick in as the promoter stops supressing price and we fly
expect new orders in a few months to boost its rating either way we go up rs jsut needs some volume to go into parabolic territory .
#impulse loading

Trendline Breakout - AKUMS
AKUMS:
Established in 2004, Akums Drugs and Pharmaceuticals Limited is a pharmaceutical contract development and manufacturing organization (CDMO) offering a comprehensive range of pharmaceutical products and services.
Technical Analysis:
Current Price: Trading at ₹558.
Trendline Breakout: Identified a trendline breakout, which is often seen as a bullish signal, suggesting the stock may start an upward trajectory after a period of consolidation or downtrend.
Strict Stop Loss: Setting a closing basis stop loss at ₹470 is a prudent risk management strategy. This helps to limit potential losses if the breakout turns out to be a false one or if market conditions turn unfavorable.
Target: Your target of ₹950 represents a significant potential upside from the current price.
Time Frame: The 1 to 6-month timeframe is a reasonable window for a technical target to be achieved, assuming the bullish momentum continues.
Fundamental Analysis:
Book Value: A book value of ₹31 suggests the stock is trading at a significant premium to its assets per share. This isn't necessarily negative but is worth noting.
P/E Ratio: The current P/E ratio of 60.7 is considerably higher than the industry P/E of 31. This could indicate that the stock is overvalued compared to its peers, or it could reflect high growth expectations for the company.
EPS Growth: The increase in Earnings Per Share (EPS) from ₹6.63 to ₹9.48 is a strong positive indicator, showing improved profitability.
Historical Growth: The pattern of sales and profit doubling every 5 years points to a consistent and potentially strong growth trajectory for the company.
Promoter and Institutional Holding: The high promoter holding of 75%, coupled with FII and DII holdings of 6% and 8% respectively, generally indicates confidence in the company's future prospects by those with significant stakes. A low public holding can sometimes reduce volatility but also limit liquidity.
Overall Assessment:
Analysis presents a mixed picture but leans bullish based on the technical breakout and strong fundamental growth indicators.
Points to Consider:
Valuation Discrepancy: The high P/E ratio compared to the industry might be a point of concern for some investors. It's important to understand the reasons behind this premium. Is it justified by significantly higher growth rates, a strong competitive advantage, or other factors?
Sustainability of Growth: While the historical growth is impressive, it's crucial to assess if this rate of doubling sales and profit is sustainable in the future.
Breakout Confirmation: As with any technical breakout, it's important to watch for confirmation in the coming days. Sustained price action above the trendline, ideally with good volume, would strengthen the bullish case.
Market Conditions: The overall market sentiment and the performance of the pharmaceutical sector can also influence Akums' stock price.

AKUMS : Breakout Candidate#AKUMS #breakoutstock #breakout
AKUMS : Swing Trade
>> Breakout Expected
>> Good Strenght & Volumes
>> Low Risk High Reward Trade
>> Upside Potential 15%
Swing Traders can lock Profit at 10% & keep trailing
Disc : Charts shared for Study Purpose only

$akumdrugsandpharmaanother multibagger on a key reclaim imo
targeting new ath shall obviously take some off the table at range high
this is one volatile stock so do not let the scare you its been included in small cap index so should do well along with new orders coming in from europe

$akumsadded some more here although went heavier in Jio F but would have been rude not to add to this since am a fair bit down
CDMO space is set to grow so this should as well .simples.
IPO listing pattern of pump dump and make people cry is almost over imo
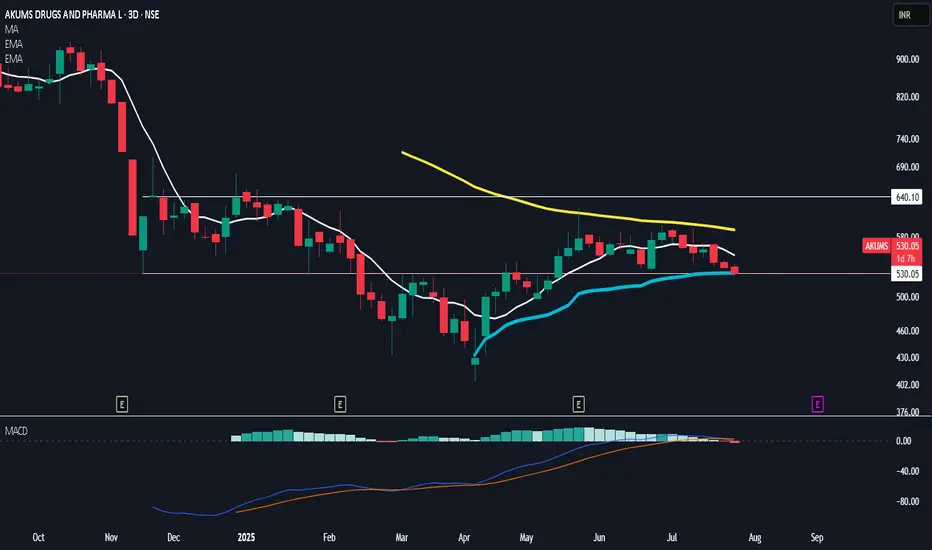
yellow line above is where vwap is from ath and also the reclaim we want for rewarding our conviction

AKUMSDisclaimer:
This is not financial advice. Please do your own research or consult with a financial advisor before making any investment decisions. Investments in stocks can be risky and may result in loss of capital.

$AKUMDRUGSANDPHARMAcan not make any sense of this considering its profit was up and looks to be a decent company
anyways thought it would be rude not to add here since fear is at its peak
rsi curling up 616 next gap to fill then 725 is the key level for things to return to normal
lowered my avg entry so can reassess at 725 when we get there IF we get there
lets see where we are in Feb

AKUMS BRUGS AND PHARMA LTD S/RSupport and Resistance Levels:
Support Levels: These are price points (green line/shade) where a downward trend may be halted due to a concentration of buying interest. Imagine them as a safety net where buyers step in, preventing further decline.
Resistance Levels: Conversely, resistance levels (red line/shade) are where upward trends might stall due to increased selling interest. They act like a ceiling where sellers come in to push prices down.
Breakouts:
Bullish Breakout: When the price moves above resistance, it often indicates strong buying interest and the potential for a continued uptrend. Traders may view this as a signal to buy or hold.
Bearish Breakout: When the price falls below support, it can signal strong selling interest and the potential for a continued downtrend. Traders might see this as a cue to sell or avoid buying.
20 EMA (Exponential Moving Average):
Above 20 EMA(50 EMA): If the stock price is above the 20 EMA, it suggests a potential uptrend or bullish momentum.
Below 20 EMA: If the stock price is below the 20 EMA, it indicates a potential downtrend or bearish momentum.
Trendline: A trendline is a straight line drawn on a chart to represent the general direction of a data point set.
Uptrend Line: Drawn by connecting the lows in an upward trend. Indicates that the price is moving higher over time. Acts as a support level, where prices tend to bounce upward.
Downtrend Line: Drawn by connecting the highs in a downward trend. Indicates that the price is moving lower over time. It acts as a resistance level, where prices tend to drop.
RSI: RSI readings greater than the 70 level are overbought territory, and RSI readings lower than the 30 level are considered oversold territory.
Combining RSI with Support and Resistance:
Support Level: This is a price level where a stock tends to find buying interest, preventing it from falling further. If RSI is showing an oversold condition (below 30) and the price is near or at a strong support level, it could be a good buy signal.
Resistance Level: This is a price level where a stock tends to find selling interest, preventing it from rising further. If RSI is showing an overbought condition (above 70) and the price is near or at a strong resistance level, it could be a signal to sell or short the asset.
Disclaimer:
I am not a SEBI registered. The information provided here is for learning purposes only and should not be interpreted as financial advice. Consider the broader market context and consult with a qualified financial advisor before making investment decisions.

$AKUMSretraced the initial listing pump
should move 25% to range high here as long as blue line holds
chop here for a bit and resume organic growth
