AMBUJACEM trade ideas


AMBUJA CEMENT - Intraday/Very short term swingThis analysis is purely based on price action.
Trade Strategy is explained in image itself. The analysis is done on 15min TF, hence can get completed in one day to couple of days
Keep trailing SL accordingly once in trade
Trade at your own risk and money management
Feel free to comment for any queries & suggestions


Ambuja Cements - Intraday Trade SetupAmbuja Cements CMP - 253.35
Range breakout and looking bullish . One can go for Intraday trade setup with the following entry, exit & targets
Buy at / above: 256 - 256.50 / Stop Loss 250
Target1: 260
Target2: 264
Target3: 268 / 270
Note: This is my view and for educational purpose only


Ambuja Cements - Intraday Trade SetupAmbuja Cements CMP - 225.30
Looking bullish and can go for Intraday trade with the following entry, exit & targets
Buy range 222 - 227 / Stop Loss 220
Target 1 - 230
Target 2 - 232
Target 3 - 235 / 240
Note: This is my view and for educational purpose only

Buy Opportunity in AMBUJACEM (Swing/Positional)This analysis is purely based in Price Action.
On Monthly Charts,
we can see that price has tested its ALL-TIME High thrice. After recent reversal from its Life-time High, price has taken support at a crucial level of 0.618 Fibo Level (If we draw Fibo from its 42.75 level to its life time high). From that level, it has shown a good reversal by forming BULLISH-HARAMI pattern. It can also be seen moving in a downward channel pattern after its fall from Life-time high.
On Weekly Charts,
It gave good breakout with volume confirmation and came down for re-testing the support. Previous to breakout, the upper end of channel was its resistance but after the breakout happened, it worked as a support for price. Retesting candle gave closing above that support which shows that chances of breakout sustaining as high.
Trading Strategy -
Entry can be made above the high of this week's candle (marked in the image).
SL can be either below the low of this week's candle or below the low of re-testing candle.
Targets are marked in the image.
SL needs to be trailed accordingly


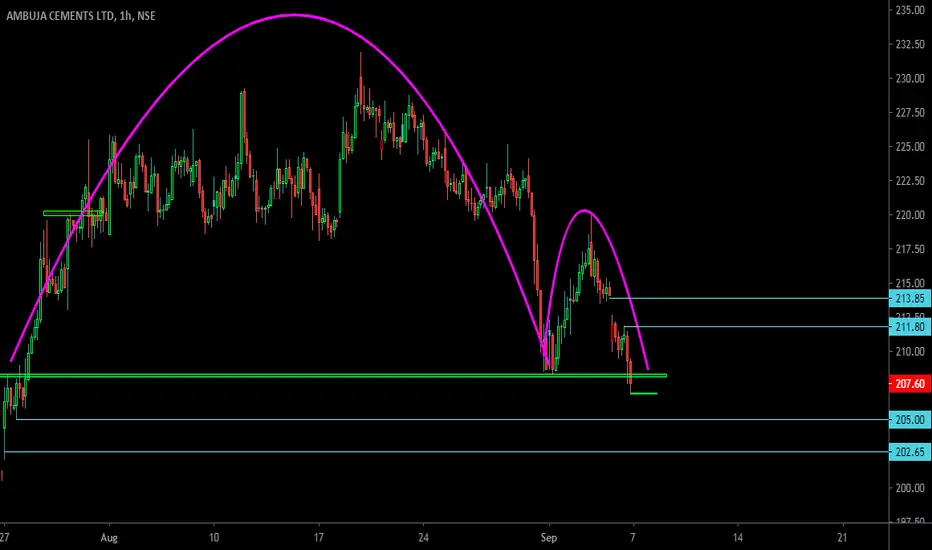
( Intraday stock selection for 7/9/2020 )The Cup and HandleThe cup and handle pattern occurs in both small time frames, like a one-minute chart, and in large time frames, like daily, weekly, and monthly charts. It occurs when there is a price wave down, followed by a stabilizing period, followed by a rally of approximately equal size to the prior decline. It creates a U-shape, or the "cup" in our "cup and handle." The price then moves sideways or drifts downward within a channel—that forms the handle. The handle may also take the form of a triangle.
The handle needs to be smaller than the cup. The handle should not drop into the lower half of the cup, and ideally, it should stay in the upper third
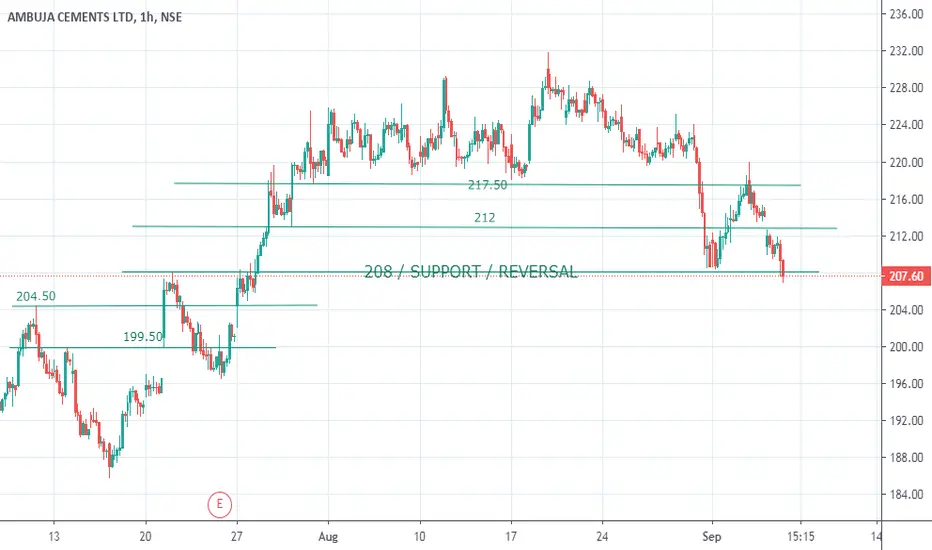
AMBUJA CEMENTSTHE LEVELS TO WATCH ARE 208, IF IT SUSTAINS BELOW THIS, THEN 204.50 AND 199.50 COMING ON DOWNSIDE
ELSE IF SUSTAINS THEN CAN SHOW 212 AND 217.50
**********************************************************************************************************************************************
Hi all,
Its pleasure to have you all here.
I have started putting these charts as a contribution from my side to all people who are new to business, as I had to struggle a lot without any sources at disposal. So please consider this a just small contribution from my side.
Few Honest Disclosures:
1. Any idea shared is my personal view, its not a recommendation, neither any kind of paid propaganda, so please
do your bit of research.
2. Ideas shared does not mean that I trade all or have position in them, this is just a helping hand to all.
3. I expect no comments or like nor any negativity, as I said its just a small helping hand from my side, please plan your risk and trade as per your capacity.
4. To trade in Cash, options or futures is your sole choice and your own risk
5. I am no expert in Tech Indicators, I believe in support resistance and trendline theory, you may use this as a supplement theory for better results.
6. I work for my own living, this is a hobby which I do sincerely to help anyone who might come across my charts.
***********************************************************************************************************************************************

set pice and volume alerts on ambuja cementwanna play the channel channel game?
here is another stock.....
if price crosses 271 with good volumes and close abobe 217, next day open abobe 217---make sure to go long... target 30% in atm call option...stoploss 7-10%....
duration of trade 2/3 days max.
go long again if price sustains on the higher side

Ambuja Cement | Buy Set up | 1st AUG Look For buy conformation (Engulf \ Pin bar) in The Mentioned Area
Hit Like ! keep Supporting !

#AMBUJACEM #AMBUJA #SHREECEM #INDIACEM #ULTRACEMCO #RAMCOCEM#AMBUJACEM
Ambuja Cements Ltd.
CMP: 222.45
Target: 243
SL: 218
If you like my work, kindly LIKE SHARE & FOLLOW for latest stock recommendations. :)


AMBUJACEMENTAMBUJACEMENT
Triangle Pattern in Ambujacement
Wait for breakout with good volume and trade

Ambuja cementHello!! Ambuja cement is one of the most famous cements of India and this is looking bullish now 233 and 236 can be seen. #MY_VIEW #LEARNER


AMBUJA CEMENT LONG ABOVE 220---224---226 ACHIEVABLEAMBUJA CEMENT IS SHOWING HIGH DELIVERY VOLUME. INDICATORS ARE BULLISH
long above 220 for levels as per chart.
short below 217.60 for levels given in green lines
HAHAHAHA LET'S GO JAI HIND!!!!
