APARINDS Trade for TomorrowApar Industries nicely moving in a tight range for more than a month, Looks like now ready to move up!
APARINDS trade ideas

APAR Industries Trading IdeaNSE:APARINDS is on the Move and we can have an Immediate Target for 8450. On the Risk Reward Part, we can Target for 10,200, if Market conditions are good, with Trailing stoploss.
APAR Ignites: Breakout Above 200 EMA Signals Bullish Surge📘 Technical Analysis Report
Stock: APAR Industries Ltd. (NSE)
Chart Type: Daily Candlestick Chart
Date: May 15, 2025
📊 Price Action
Current Price: ₹7,941.00
Daily Change: +₹1,013.50 (+14.63%)
Strong bullish candlestick observed with significant upward momentum.
V-shaped recovery from recent lows near ₹5,000, indicating a reversal from the downtrend.
🧠 Moving Averages
20 EMA (Red): ₹6,058.67
50 EMA (Orange): ₹6,086.08
100 EMA (Cyan): ₹6,794.72
200 EMA (Blue): ₹7,380.56
Price has broken above all key EMAs, including the 200 EMA — a strong bullish signal.
Golden crossover signals a shift in long-term trend direction.
📈 Volume Analysis
Substantial volume spike on the breakout day.
Volume confirms price action, indicating strong institutional buying interest.
🔍 Support & Resistance Levels
Immediate Support Zone: ₹6,800 – ₹7,300
Previous Resistance (now support): ₹7,380 (200 EMA)
Next Resistance Levels: ₹8,100 – ₹8,300 (previous swing highs)
🧭 Trend & Momentum
Market structure shows a transition to higher highs and higher lows.
Momentum is strong with a confirmed breakout above consolidation.
Sustained strength above 200 EMA points to a trend reversal to the upside.
📌 Outlook & Strategy
Bullish Bias: Breakout confirmed by price and volume.
If sustained above ₹7,380: Likely upside target is ₹8,300–₹8,500.
On pullbacks: ₹7,300–₹7,400 could act as a demand zone and provide buying opportunities.
Ideal for trend-following traders and short- to mid-term positional setups.

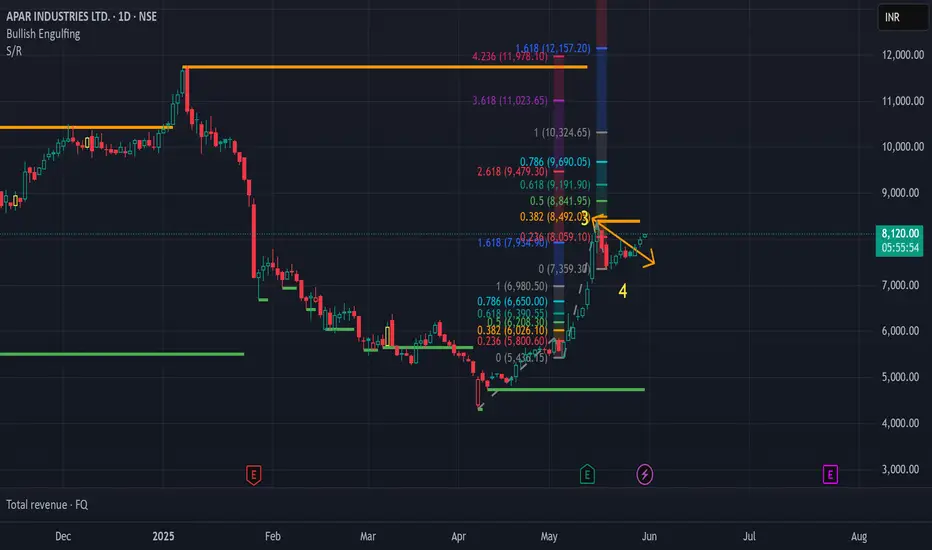
APAR INDUSTRIES LTD S/R Support and Resistance Levels:
Support Levels: These are price points (green line/shade) where a downward trend may be halted due to a concentration of buying interest. Imagine them as a safety net where buyers step in, preventing further decline.
Resistance Levels: Conversely, resistance levels (red line/shade) are where upward trends might stall due to increased selling interest. They act like a ceiling where sellers come in to push prices down.
Breakouts:
Bullish Breakout: When the price moves above resistance, it often indicates strong buying interest and the potential for a continued uptrend. Traders may view this as a signal to buy or hold.
Bearish Breakout: When the price falls below support, it can signal strong selling interest and the potential for a continued downtrend. Traders might see this as a cue to sell or avoid buying.
MA Ribbon (EMA 20, EMA 50, EMA 100, EMA 200) :
Above EMA: If the stock price is above the EMA, it suggests a potential uptrend or bullish momentum.
Below EMA: If the stock price is below the EMA, it indicates a potential downtrend or bearish momentum.
Trendline: A trendline is a straight line drawn on a chart to represent the general direction of a data point set.
Uptrend Line: Drawn by connecting the lows in an upward trend. Indicates that the price is moving higher over time. Acts as a support level, where prices tend to bounce upward.
Downtrend Line: Drawn by connecting the highs in a downward trend. Indicates that the price is moving lower over time. It acts as a resistance level, where prices tend to drop.
Disclaimer:
I am not a SEBI registered. The information provided here is for learning purposes only and should not be interpreted as financial advice. Consider the broader market context and consult with a qualified financial advisor before making investment decisions.

Apar Industries: Detailed Long Positional Trade Idea Apar Industries: Detailed Long Positional Trade Idea 🚀
Technical Setup: A classic Inverse Head and Shoulders breakout on the daily chart, indicating a strong bullish reversal. The breakout is supported by rising volumes, confirming buying interest.
Entry Point: Enter above ₹10,950 for a confirmed breakout.
Stop Loss: Place a stop loss at ₹10,300 to manage downside risk.
Target Levels:
Target 1: ₹11,600
Target 2: ₹12,200
Indicators:
RSI at 69 indicates increasing bullish momentum but still below the overbought zone.
Moving averages aligned positively, supporting upward movement.
Risk/Reward: Favorable setup with a clear breakout structure.
Note: Monitor for sustained breakout above ₹10,950. Avoid entry if price fails to hold above the neckline.
#AparIndustries #StockMarket #TradingIdeas #PositionalTrade

Quick APARINDS (APAR INDUSTRIES) long tradeJust for fun and in case anyone who follows me is from India, I thought I'd take a crack at a Nifty stock.
NSE:APARINDS is oversold at the bottom of an upward channel going back to the beginning of the year. Since then, my algo entry along with my FPC exit strategy would be 17-0. Given its uptrend, I'm not that impressed, but I try not to throw out dogs, in case anyone trades this exercise in edutainment (you should always do your own research and choose suitable investments).
I'll add more if it stays oversold and sell any lot at the first profitable close, though being in the US I think I'll be asleep at the close in India, so you'll just have to imagine I sell profitable lots at the close or buy new ones then on an oversold day.
Its price is currently 8802.2

Apar Industries - Cup and HandleApar Industries - Cup and Handle is confirmed on the daily basis. The cup is formed, no overhead. trending --30% up , cup formed 15% down. RS Positive. Above 21 and 50 DMA

APAR INDUSTRIES LTD S/R Support and Resistance Levels:
Support Levels: These are price points (green line/shade) where a downward trend may be halted due to a concentration of buying interest. Imagine them as a safety net where buyers step in, preventing further decline.
Resistance Levels: Conversely, resistance levels (red line/shade) are where upward trends might stall due to increased selling interest. They act like a ceiling where sellers come in to push prices down.
Breakouts:
Bullish Breakout: When the price moves above resistance, it often indicates strong buying interest and the potential for a continued uptrend. Traders may view this as a signal to buy or hold.
Bearish Breakout: When the price falls below support, it can signal strong selling interest and the potential for a continued downtrend. Traders might see this as a cue to sell or avoid buying.
20 EMA (Exponential Moving Average):
Above 20 EMA(50 EMA): If the stock price is above the 20 EMA, it suggests a potential uptrend or bullish momentum.
Below 20 EMA: If the stock price is below the 20 EMA, it indicates a potential downtrend or bearish momentum.
Trendline: A trendline is a straight line drawn on a chart to represent the general direction of a data point set.
Uptrend Line: Drawn by connecting the lows in an upward trend. Indicates that the price is moving higher over time. Acts as a support level, where prices tend to bounce upward.
Downtrend Line: Drawn by connecting the highs in a downward trend. Indicates that the price is moving lower over time. It acts as a resistance level, where prices tend to drop.
RSI: RSI readings greater than the 70 level are overbought territory, and RSI readings lower than the 30 level are considered oversold territory.
Combining RSI with Support and Resistance:
Support Level: This is a price level where a stock tends to find buying interest, preventing it from falling further. If RSI is showing an oversold condition (below 30) and the price is near or at a strong support level, it could be a good buy signal.
Resistance Level: This is a price level where a stock tends to find selling interest, preventing it from rising further. If RSI is showing an overbought condition (above 70) and the price is near or at a strong resistance level, it could be a signal to sell or short the asset.
Disclaimer:
I am not a SEBI registered. The information provided here is for learning purposes only and should not be interpreted as financial advice. Consider the broader market context and consult with a qualified financial advisor before making investment decisions.

Apar industries swingFlag pattern breakout
This type of flag b.o yield is high
Company is good as well as delivered good results
Short term gains and stock is good to hold for long term also.
Levels are marked according to fib levels.


APARINDSStock name = Apar Industries Limited.
Weekly chart setup
Chart is self explanatory. Levels of breakout, possible up-moves (where stock may find resistances) and support (close below which, setup will be invalidated) are clearly defined.
Master Score - B
Disclaimer: This is for demonstration and educational purpose only. this is not buying and selling recommendations. I am not SEBI registered. please consult your financial advisor before taking any trade.

APARIND broke-out from 6-month consolidation.APAR INDUSTRIES made a strong breakout on over 6 times average volume from a 6-month long consolidation. The Technical structure on monthly, weekly, and daily charts (daily chart attached for reference) is quite bullish. Even the fundamentals are good as both EPS and Sales have been rising since March’22 quarter.
Only personal analysis. No recommendation.


A perfect example of channel patternThe stock is moving back into the channel from its lower age just went out a little bit so I understand from here it will give full respect to its channel

APARINDS: Navigating the Uptrend Channel with Support and ResistGreetings, fellow technical enthusiasts! Today, we set our sights on APARINDS, a stock listed on the NSE exchange, embarking on a technical analysis voyage guided by the celestial beacons of trend channels, support and resistance lines.
Charting the Uptrend Corridor:
Green Guardian: Our journey begins with the verdant green line, a stalwart resistance barrier forged from the highest highs of the past two months. This formidable wall stands as a test of bullish mettle, a hurdle that must be surmounted before further ascension.
Crimson Bastion: Below this emerald sentinel lies the crimson red line, a sturdy support level born from the lowest lows of the past three months. This foundational pillar serves as a safety net, a point of refuge should the bulls encounter temporary setbacks.
Regression's Guiding Light: Spanning this verdant and crimson domain, we find the ethereal blue channel, a product of regression magic. This celestial pathway, drawn from the heart of the August 21st doji and extending to today's bullish candle, offers a roadmap for potential price movements within the uptrend.
Decoding the Bullish Whispers:
With these technical omens in hand, what can we glean about APARINDS's future trajectory?
The confluence of the green resistance line and the upper regression channel boundary creates a critical zone to watch. A decisive break above this area could signal further bullish momentum, potentially paving the way for higher ground.
The red support line and the lower regression channel border form a crucial support zone. Should the price dip below this area, it would indicate a potential loss of bullish control, warranting caution and close monitoring.
The recent strong bullish candle, nestled within the regression channel, suggests continued upward pressure. However, remember that technical analysis is not a crystal ball, and unforeseen factors can always alter the course.
Trading Prudence:
While the technical landscape hints at bullish potential, remember, dear reader, that caution is your compass. Always practice sound risk management, set stop-loss orders to mitigate potential losses, and never chase the market blindly.
May your APARINDS trades be as fruitful as the insights we have gleaned today!
Note: Please be aware that market conditions and price movements can change rapidly. Always conduct your own thorough research and analysis before making any trading decisions.

APAR Industries Ltd Trend AnalysisVolume is drying up with volatility kicking in.
I don't see any further upside.
Better to look for exiting opportunities or trail with stop loss.
It has formed an ABC wave on cycle degree with target range highlighted.
Do your own due diligence before taking any action.
Peace!!

APARIND for Swing tradingStock looks good for small target. Good price action and RSI formation seen.


APARINDS YEARLY CHART ANALYSISAparinds yearly chart last 2 year volumen is high and price is continusuly up this is the good signal for the investor

Classic Chart Pattern.Apar Industries has broken out today but I hold a contra view due to this headline from which it has rejected multiple times.

apar industrylikely to move up soon
breakout>>>>>>>>>>>>>>>>>>>>>>>>>>>>>>>>>>>>>>
>>>>>>>>>>>>>>>>>>>>>>>>>>>>>>>>
>>>>>>>>>>>>>>>>>>>>>>>>>>>>>>>>>>>
>>>>>>>>>>>>>>>>

Apar Industry Channel Pattern near Breakout on Hourly TFApar industry has formed channel pattern in an hourly time frame if strongly breakout, can expect higher target- stock with good fundamentals as well

Apar Industries Ltd.C&H Pattern: Monthly Basis
Price / Vol. Consolidation/BreakOut & Builtup
*With Price Up, Trail Stop Loss*
*Book Profit as per Risk Appetite*
*Fundamentally Strong Co*
Engaged in manufacturing of TSO / Transmission & Distribution Overhead
Conductors: Total installed capacity: 5,42,000 KL & 1,80,000 MT.
Presence in more than 100 countries. Amongst top 3 producers of Conductors / Specialty Oils in world.
Increasing Sales/Profitability on Qtrly / Yrly Basis.
RoA/RoE/RoCE: Improved in FY22
Strong TNW / Low Equity / Increasing Cash Reserve / Moderate Leverage.
Continued +ve Ops. Cash Flow /Improved WC Cycle.
Holding Up: Promoter/DIIs.
*Concern:*
WC intensive. Higher Volatility of RM.
*Do Your Own Research as Well. This is Just an Opinion.*
Your Opinion may Differ/Respected.
Happy Investing :)
