APL APOLLO TUBES Ltd. 1W📈 APL Apollo Tubes Ltd. – Bullish Channel Breakout
🔍 Pattern Insight:
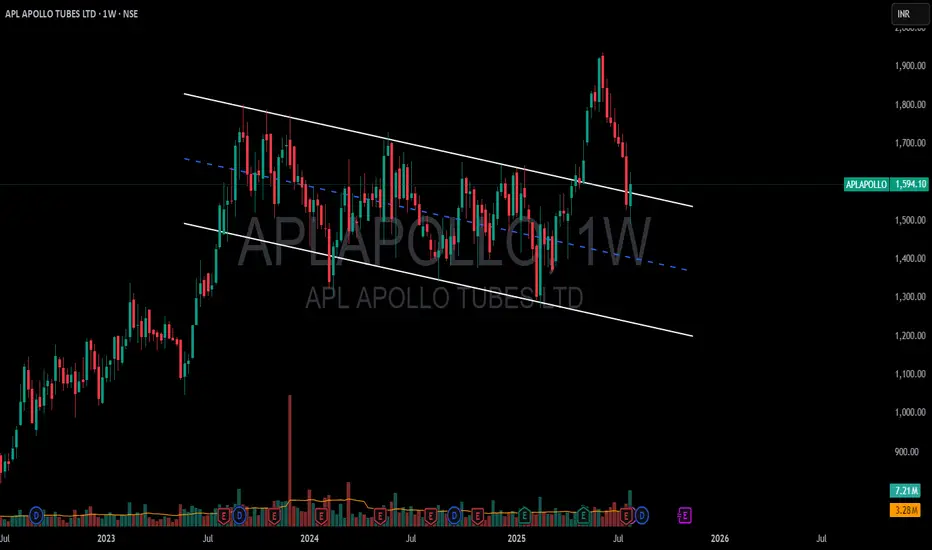
Pattern: Bullish Channel (Falling or Rising?) Breakout
(Most likely a falling channel, which is bullish when broken upward)
Current Price: ~₹1594
Breakout Status: ✅ Breakout done
Current Action: 🔁 Retest phase underway
All-Time High (ATH): ₹1,685 (approx as per recent charts)
📊 Technical Setup:
Aspect Details
🔓 Breakout Type Bullish channel (indicates trend reversal or continuation)
🔁 Retest Currently testing breakout zone (bullish if holds ~₹1580–1600)
🔥 Confirmation High volumes + bullish candle near ₹1600
📈 Next Resistance ₹1640 → ₹1685 (ATH)
🧨 Break Above ATH Blue sky breakout; target can go into uncharted territory
🎯 Target Zones After Momentum:
Phase Target
✅ Breakout Sustains ₹1640 (minor supply)
🔼 ATH Challenge ₹1685 (strong resistance)
🚀 Post ATH ₹1750 → ₹1800 (based on Fibonacci or channel projection)
🛡️ Risk Management (Invalidation Levels):
Retest below ₹1575–1560 with strong red candle and volume = ⚠️ weak setup
Better to keep a stop-loss below ₹1550 if swing trading
📅 Strategy Suggestion:
🧪 If you're planning an entry:
✅ Entry Zone: ₹1590–1600 (post confirmation of support)
🛑 Stop-loss: ₹1548 (safely below breakout zone)
🎯 Targets:
1st: ₹1640
2nd: ₹1685
3rd (if ATH breaks): ₹1750+
📌 Summary:
APL Apollo has shown a bullish channel breakout ✅
Retest in progress → if buyers defend ~₹1580–1600 zone with volume, uptrend may resume
Potential to break ATH of ₹1685 if momentum continues
Watch volume and Nifty Metal Index for broader confirmation
Disclaimer: The information provided is for educational and informational purposes only and should not be considered as financial advice. Investing in the stock market involves risk, and past performance is not indicative of future results. Please consult with a certified financial advisor or conduct your own research before making any investment decisions. We are not responsible for any losses incurred as a result of using this information. Stock market investments are subject to market risks; read all related documents carefully.
APLAPOLLO trade ideas
APLAPOLLO - retest phase?APL Apollo – Chart Analysis
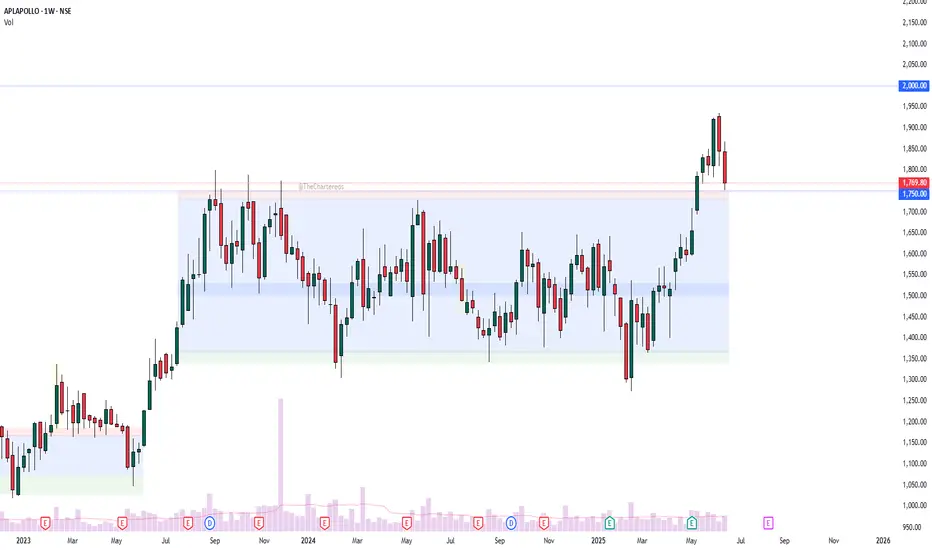
The structure is quite clear:
Price consolidated within a tight range for nearly 2 years.
This was followed by a strong breakout accompanied by a notable volume spike.
Currently, the stock appears to be in the retest phase of the breakout zone.
Fundamental Trigger:
📢 APL Apollo Q4 Results: Net profit up 72% YoY; Board approves ₹1,500 Cr capex plan.
What’s next?
Will the retest hold and lead to the next leg up?
Let me know your thoughts 👇
Disclaimer: This analysis is for educational and informational purposes only. It is not investment advice or a recommendation to buy or sell any security. Please do your own research or consult a financial advisor before making any investment decisions. I am not a SEBI-registered advisor.
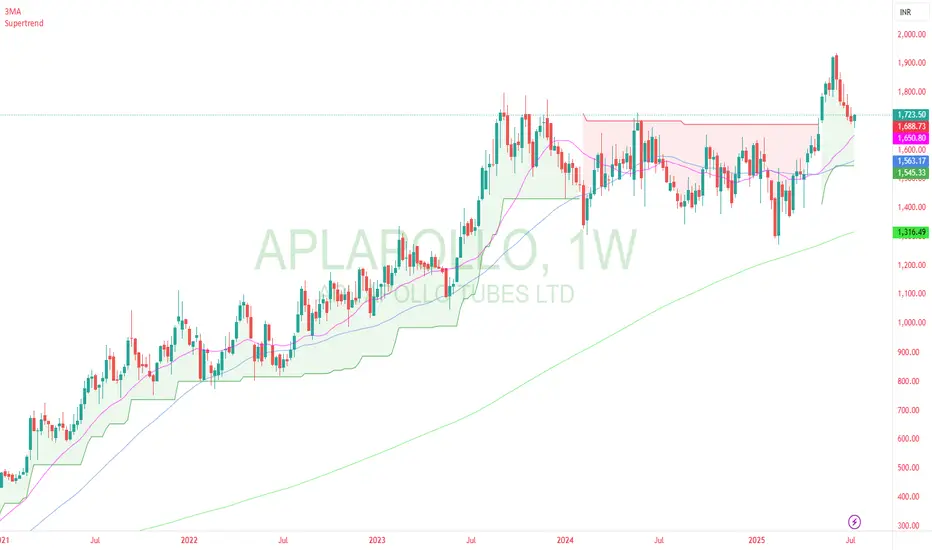
apl apollo - pullback trade apl apollo has given multimonth break out and stock gone upto 2000. Now stock has done puckback to previous resistance and stock is near ema 21 on weekly chart. This is best low risk high reward entry in good quality company/
APL APOLLO TUBES - Rectabgular PatternNSE:APLAPOLLO in 2 Year Break Out. It has formed a Rectangular Pattern. If it's able to sustain above 1810, you can Target for 1900 and Exit.

Apl apolloApl apollo looks good above 1827 fr targets 1865…1940…2010. Sl 1780
Bullish structure. Good positional hold

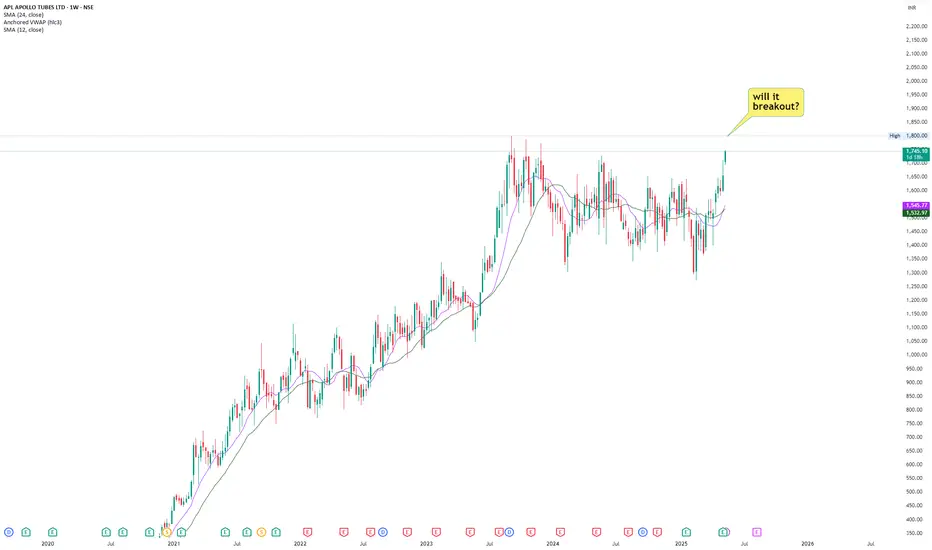
APLAPOLLO- All time high possible!!!APLAPOLLO is nearing its all time high level. Stock is nearing this level with relatively higher volume.
Stock has recorded double digit growth in last consecutive 2 quarters.
Margins have also expanded by roughly 40%.
Company has also expanded its CAPEX budget in coming years.
Overall it's a good technofunda stock to watch. Add to watchlist.
APL Apollo tubesThis depicts a technical pattern known as the "Cup and Handle" pattern.
If the breakout is successful, an upward bullish trend can be expected.
However, if the breakout fails, the stock may turn bearish.
If you find this helpful and want more FREE forecasts in TradingView, Hit the 'BOOST' button
Drop some feedback in the comments below! (e.g., What did you find most useful?
How can we improve?)
Your support is appreciated!
Now, it's your turn!
Be sure to leave a comment; let us know how you see this opportunity and forecast.
Have a successful week
DISCLAIMER: I am NOT a SEBI registered advisor or a financial adviser. All the views are for educational purpose only

APLAPOLLO Looks good to break ATHGood consolidation at resistance....can go up above 1647.
This is only for analysis

"Channel Pattern" *|| Apl Apollo Tubes Ltd||*
* 2Year Consolidation touched on resistance multiple times trend line Year June -2023 TO April-25.
* Expected To reach at the next level. Price level - 2660

APL Apollo Tubes: APL Apollo Tubes:
On the verge of a breakout.
Watch for the closing to get a clear signal.
This trade has a higher profitability if well taken.
Keep Learning.
Note: Do your own due diligence before taking any action.

APL Apollo Tubes | Trading AnalysisThe chart for APL Apollo Tubes shows a significant price movement over the past few years, with a notable peak around mid-2024 followed by a downward trend as of April 18, 2025. The stock reached a high of approximately INR 1,800 before declining to its current level near INR 1,594.
Investor Holdings
Franklin Templeton: Increased holdings from 1.2% (2024-12) to 1.42% (2025-03)
Government of Norway: New 1.8% stake in 2025-03.
Vanguard Funds: New 1.0% stake in 2025-03.
These changes in institutional holdings could signal a positive long-term outlook despite the recent price drop.

Stock to watch out - APL ApolloStrong name within Metal stocks portfolio. Largest producer for structural steel tubes. The stock has been consolidating for many months. Volumes has been consistent. Company has good domestic market share. Though there might be some bumps due to the tariff news, but given the history it has sustained well.
Expecting a good run with a long term view.
Thanks
Note: Not a buy/sell recommendation. View shared for educational/study purpose.

Apollo Tubes, 1WChannel Pattern is Looking Very Good , Take little Time to Breakout from the Pattern
Enter only after the Breakout of Upper Trendline
Stop line Should be Minimal so your profit should be High , Follow 1:2 Risk, Reward minimal in Every Trade .
Follow For More Swing Ideas Like This

Aplapollo tubesAll is well
Good day
Just my view and educational purposes only I'm not a SEBI registered advisory...trade on your own risk.
This is simple ORB Strategy with volume breakout..i will enter EOD 3.25pm if the price trade above the blue line and after entry I will wait for my target or stoploss (D candle should close below the red line) in valid if direct not triggered and closed below red line..
Just a view educational purposes only

APLAPOLLO CMP 1560.On daily candle this stock looking very strong.If sustain above levels we can see 1600..........1650..........then 1700 Levels.Add this to your wach list.Risk Reward is Best Low risk High reward Setup showing.Find your best Entry Exit Zone Thank You.

APLAPOLLO 14% or 26% UP?CMP 1518
Entry might be good around 1510 with accumulation around 1400ish area downwards averaging.
If gives immidiate breakout, pull back @ 1590 is good entry or later pull back @ 1550ish is good.
Targets are 1800 with extended target@ 2000 according to fib levels.

APL APOLLO TUBES LTD S/R Support and Resistance Levels:
Support Levels: These are price points (green line/shade) where a downward trend may be halted due to a concentration of buying interest. Imagine them as a safety net where buyers step in, preventing further decline.
Resistance Levels: Conversely, resistance levels (red line/shade) are where upward trends might stall due to increased selling interest. They act like a ceiling where sellers come in to push prices down.
Breakouts:
Bullish Breakout: When the price moves above resistance, it often indicates strong buying interest and the potential for a continued uptrend. Traders may view this as a signal to buy or hold.
Bearish Breakout: When the price falls below support, it can signal strong selling interest and the potential for a continued downtrend. Traders might see this as a cue to sell or avoid buying.
20 EMA (Exponential Moving Average):
Above 20 EMA(50 EMA): If the stock price is above the 20 EMA, it suggests a potential uptrend or bullish momentum.
Below 20 EMA: If the stock price is below the 20 EMA, it indicates a potential downtrend or bearish momentum.
Trendline: A trendline is a straight line drawn on a chart to represent the general direction of a data point set.
Uptrend Line: Drawn by connecting the lows in an upward trend. Indicates that the price is moving higher over time. Acts as a support level, where prices tend to bounce upward.
Downtrend Line: Drawn by connecting the highs in a downward trend. Indicates that the price is moving lower over time. It acts as a resistance level, where prices tend to drop.
RSI: RSI readings greater than the 70 level are overbought territory, and RSI readings lower than the 30 level are considered oversold territory.
Combining RSI with Support and Resistance:
Support Level: This is a price level where a stock tends to find buying interest, preventing it from falling further. If RSI is showing an oversold condition (below 30) and the price is near or at a strong support level, it could be a good buy signal.
Resistance Level: This is a price level where a stock tends to find selling interest, preventing it from rising further. If RSI is showing an overbought condition (above 70) and the price is near or at a strong resistance level, it could be a signal to sell or short the asset.
Disclaimer:
I am not a SEBI registered. The information provided here is for learning purposes only and should not be interpreted as financial advice. Consider the broader market context and consult with a qualified financial advisor before making investment decisions.

APL Apollo Bullish Breakout – Eyeing Higher Resistance Levels!➡️ Bullish breakout above ₹1510.45
➡️ Next targets at ₹1586.95, ₹1654.25, ₹1728.75

Confluence of factors in APL APOLLO TUBES LTD.In addition to all the points mentioned in the chart, APL APOLLO has also made its 60 months bottoms and this low should not break for the next 60 months

APL Apollo : Strong Buy ZoneThe price of an instrument is most likely influenced by its dominant cycle. We can identify specific support levels based on the volatility of this dominant cycle.
The Dark Green zone is a strong buy zone, where the price is likely to rise.
Trading cycles are short-term and also help define short-term support levels.
The price is currently in a strong buy zone for both the dominant cycle and the trading cycle in the 75-minute timeframe. This suggests that it may be a good investment for 2-3 months, with a target of the Resistance 3 zone.
Thanks

Aplapollo bearishtried to break resistance multiple times and failed. think we go lower to the support, fill those wicks and then make the next move. lets see where we get to.

APL Tubes LongAPL Apollo Tubes Trend Demand/Supply Price
6 Month UP Demand Momentum Support Price 1193
Qtrly UP Consolidation
MONTH UP Demand Momentum Support Price 1395
Week UP WDMIP Support Price 1160
Daily UP DDMIP Support Price1335
Stop Loss 1272
Potential Target 2300

APL APOLLO TUBES BRAKE OUT NSE:APLAPOLLO
Apl Apollo Tubes gives double brake out on daily chart
Buy @ 1610-1620
SL 1550
Targets 1850-2000
