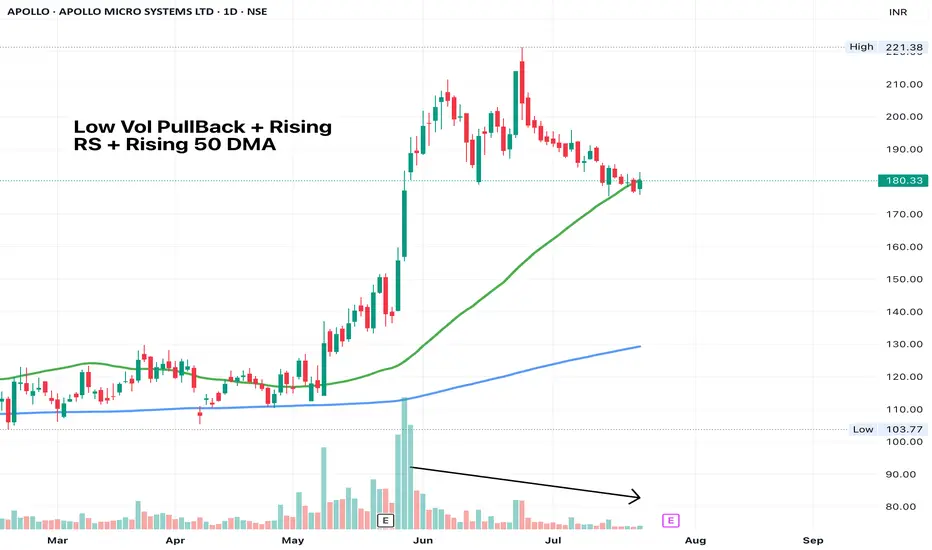
APOLLO - Low vol PullbackWait for one good wide-range candle to take entry. Price often cuts below 50 DMA, forms a small base and gives a breakout candle. This might do that.
SL - Low of the pullback
Next report date
—
Report period
—
EPS estimate
—
Revenue estimate
—
2.18 INR
563.96 M INR
5.62 B INR
134.61 M
About APOLLO MICRO SYSTEMS LTD
Sector
Industry
CEO
Karunakar Reddy Baddam
Website
Headquarters
Hyderabad
Founded
1997
ISIN
INE713T01028
FIGI
BBG00JPBZS06
Apollo Micro Systems Ltd. engages in the manufacture of electronic components and systems. It includes electronic manufacturing, hardware design, information technology and software, electronic, and mechanical services. It also offers space, and transportation solutions. The company was founded by Baddam Karunakar Reddy on March 3, 1997 and is headquartered in Hyderabad, India.
Related stocks
Apollo Micro Systems - Long*Apollo Micro Systems - CMP - 124 / Positional Trade*
*Buy Range 120 - 125 ONLY / Stop Loss 85 in weekly candle closing*
*Target 1 - 150*
*Target 2 - 165*
*Target 3 - 180 / 200*
Disclaimer: This is my view and for educational purpose only.

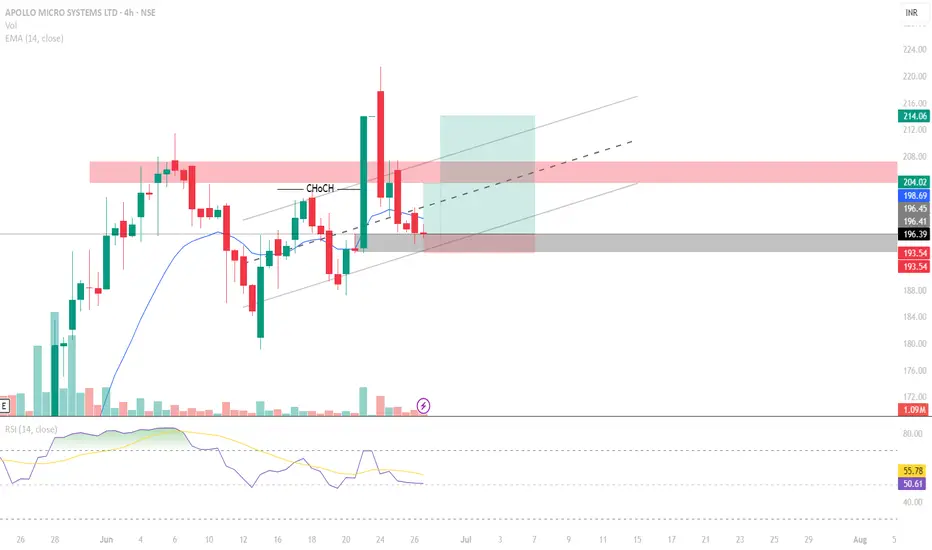
APOLLO MICRO SYSTEMSA 4 Hour CHoCH seen with a huge green closing candle
Tapped into the 50 % OB region
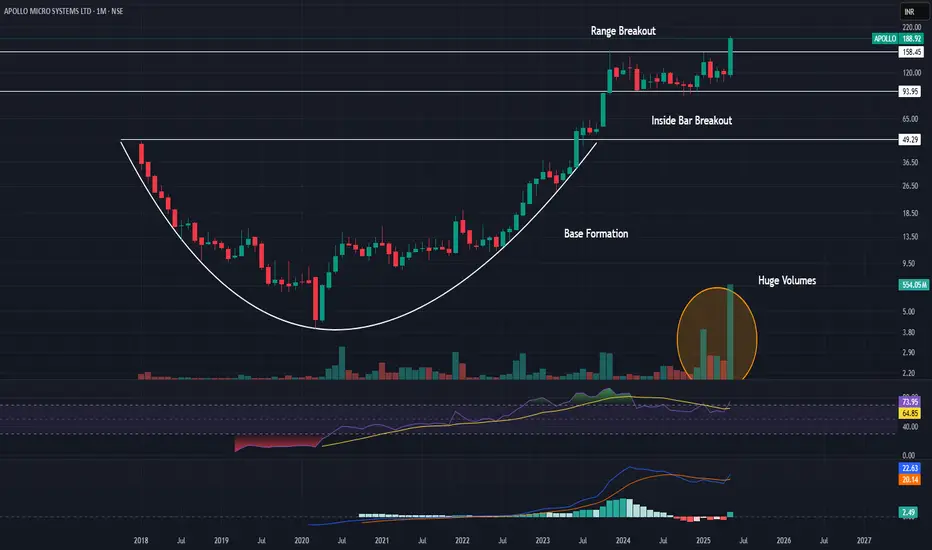
Flag Breakout in Apollo Micro Systems1. Inside Bar Breakout
2. Good Volume
3. Consolidation Breakout
4. RSI above 70
5. MACD signal turning green
Technical Analysis of Apollo Micro Systems LtdTechnical Analysis of Apollo Micro Systems Ltd
Based on the Weekly Time Frame chart, here's a technical analysis of Apollo Micro Systems Ltd (NSE: APOLLO):
Price Action:
Downward Trend: The overall trend seems to be bearish, with the price forming lower highs and lower lows.
Support and Re

Positional Setup – APOLLOMICRO (CMP ₹146.25)🟢 Today’s Action:
Closed at ₹146.25, up +8.33%, showing strong bullish momentum.
Broke out from key resistance at ₹133.18 on strong volume – a clear breakout confirmation.
📈 Technical Highlights:
Resistance at ₹164.17 is the next visible upside target.
Strong support now at ₹133.18, which was pre

APOLLO MICRO SYSTEM LTD- FOR LONG HOLDING POSITION AND SWINGGood bullish candle braekout in Daily time frame. C.P is 130.21 . price range from 122 to 124 can be the reversal area for upside. If price takes a reversal form that point we can go long for swing next week .

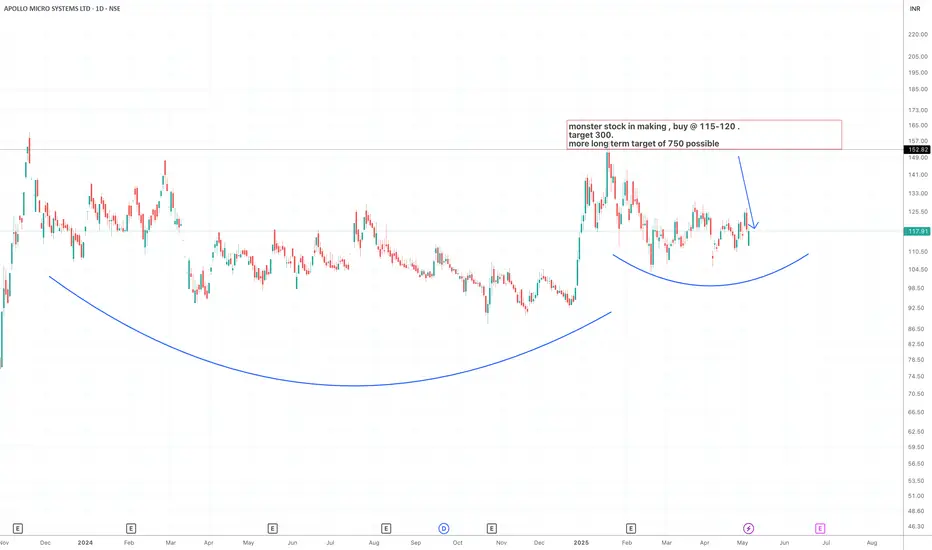
Apollo Micro Systems Target ₹300 soonMonster Stock Alert: Apollo Micro Systems
Two massive cups forming on the daily chart.
📉 Accumulation done.
📈 CMP ₹118 → Target ₹300 soon, ₹750 long-term possible!
Buy zone: ₹115–120.
#Multibagger #Smallcap #ApolloMicro #BreakoutStocks #IndiaGrowthStory
APOLLO Setting up for a HUGE BreakoutNSE:APOLLO - Breakout Setup
🔹 Current Price: ₹122.44 (+2.43%)
🔹 Ascending Trendline Acting as Support
🔹 Potential Upside Target: ₹183.30 (+49.28%)
Technical Analysis:
✅ Strong bullish momentum with higher lows
✅ Breakout confirmation expected around ₹140-150
✅ Volume increase supports upward mov

Apollo momentum comingAs per technical analysis Apollo momentum coming price cross 70 ema
Nearly 30 40% momentum expect
Stock going now LH TO HH

See all ideas
Summarizing what the indicators are suggesting.
Oscillators
Neutral
SellBuy
Strong sellStrong buy
Strong sellSellNeutralBuyStrong buy
Oscillators
Neutral
SellBuy
Strong sellStrong buy
Strong sellSellNeutralBuyStrong buy
Summary
Neutral
SellBuy
Strong sellStrong buy
Strong sellSellNeutralBuyStrong buy
Summary
Neutral
SellBuy
Strong sellStrong buy
Strong sellSellNeutralBuyStrong buy
Summary
Neutral
SellBuy
Strong sellStrong buy
Strong sellSellNeutralBuyStrong buy
Moving Averages
Neutral
SellBuy
Strong sellStrong buy
Strong sellSellNeutralBuyStrong buy
Moving Averages
Neutral
SellBuy
Strong sellStrong buy
Strong sellSellNeutralBuyStrong buy
Displays a symbol's price movements over previous years to identify recurring trends.
Frequently Asked Questions
The current price of APOLLO is 169.94 INR — it has decreased by −2.14% in the past 24 hours. Watch APOLLO MICRO SYSTEMS LTD stock price performance more closely on the chart.
Depending on the exchange, the stock ticker may vary. For instance, on NSE exchange APOLLO MICRO SYSTEMS LTD stocks are traded under the ticker APOLLO.
APOLLO stock has fallen by −1.08% compared to the previous week, the month change is a −11.49% fall, over the last year APOLLO MICRO SYSTEMS LTD has showed a 42.51% increase.
APOLLO reached its all-time high on Jun 24, 2025 with the price of 221.38 INR, and its all-time low was 3.95 INR and was reached on Mar 25, 2020. View more price dynamics on APOLLO chart.
See other stocks reaching their highest and lowest prices.
See other stocks reaching their highest and lowest prices.
APOLLO stock is 3.38% volatile and has beta coefficient of 1.37. Track APOLLO MICRO SYSTEMS LTD stock price on the chart and check out the list of the most volatile stocks — is APOLLO MICRO SYSTEMS LTD there?
Today APOLLO MICRO SYSTEMS LTD has the market capitalization of 52.10 B, it has decreased by −3.84% over the last week.
Yes, you can track APOLLO MICRO SYSTEMS LTD financials in yearly and quarterly reports right on TradingView.
APOLLO MICRO SYSTEMS LTD is going to release the next earnings report on Nov 7, 2025. Keep track of upcoming events with our Earnings Calendar.
APOLLO net income for the last quarter is 185.12 M INR, while the quarter before that showed 140.04 M INR of net income which accounts for 32.19% change. Track more APOLLO MICRO SYSTEMS LTD financial stats to get the full picture.
Yes, APOLLO dividends are paid annually. The last dividend per share was 0.05 INR. As of today, Dividend Yield (TTM)% is 0.03%. Tracking APOLLO MICRO SYSTEMS LTD dividends might help you take more informed decisions.
APOLLO MICRO SYSTEMS LTD dividend yield was 0.20% in 2024, and payout ratio reached 13.44%. The year before the numbers were 0.05% and 4.02% correspondingly. See high-dividend stocks and find more opportunities for your portfolio.
EBITDA measures a company's operating performance, its growth signifies an improvement in the efficiency of a company. APOLLO MICRO SYSTEMS LTD EBITDA is 1.48 B INR, and current EBITDA margin is 22.99%. See more stats in APOLLO MICRO SYSTEMS LTD financial statements.
Like other stocks, APOLLO shares are traded on stock exchanges, e.g. Nasdaq, Nyse, Euronext, and the easiest way to buy them is through an online stock broker. To do this, you need to open an account and follow a broker's procedures, then start trading. You can trade APOLLO MICRO SYSTEMS LTD stock right from TradingView charts — choose your broker and connect to your account.
Investing in stocks requires a comprehensive research: you should carefully study all the available data, e.g. company's financials, related news, and its technical analysis. So APOLLO MICRO SYSTEMS LTD technincal analysis shows the sell today, and its 1 week rating is buy. Since market conditions are prone to changes, it's worth looking a bit further into the future — according to the 1 month rating APOLLO MICRO SYSTEMS LTD stock shows the buy signal. See more of APOLLO MICRO SYSTEMS LTD technicals for a more comprehensive analysis.
If you're still not sure, try looking for inspiration in our curated watchlists.
If you're still not sure, try looking for inspiration in our curated watchlists.