ARCHIDPLY : POISED FOR A BREAKOUT?ARCHIDPLY IND. LTD.: Poised for a Breakout? 🚀
Chart Description
The chart for ARCHIDPLY IND. LTD. on the NSE displays daily price movements with key technical levels and zones. The current price is ₹113.19 , reflecting an upward move of 2.50% . Annotations highlight important areas such as Wave C completion, deep retracement, liquidity buildup, target zones, and support zones.
Key Levels and Zones
Wave C Completion Zone (₹104-₹108):
This is marked as a potential completion area for corrective Wave C. Recent testing of this zone shows upward movement, indicating support.
Deep Retracement Zone (₹108.14-₹111.90):
Aligned with Fibonacci 113%-127% , this zone represents a significant retracement. A reversal from this level is possible.
Liquidity Buildup Zone:
Around the current price, this zone shows liquidity accumulation, suggesting potential for significant price movement.
First Target Zone (₹145-₹150):
Initial target for upward movement if the price breaks above the liquidity buildup zone.
Profit Booking Zone (₹149.30-₹156.33):
A higher target zone for profit booking after significant upward movement.
Support Zone (₹75-₹84):
The lower zone could be tested if the price breaks below the deep retracement zone.
Trading Plan
Entry Points:
Primary Entry: Enter long near the Wave C completion zone ( ₹104-₹108 ) if reversal signals appear.
Secondary Entry: Consider another entry near the deep retracement zone ( ₹108.14-₹111.90 ) if reversal signals confirm.
Stop Loss:
Set a stop loss at ₹99.79 to manage risk if the price breaks below the deep retracement zone.
Target Levels:
First Target: ₹145-₹150
Final Target: ₹149.30-₹156.33
Risk Management:
Monitor the liquidity buildup zone carefully. Exit if the price fails to break above this zone. Adjust stop loss and targets based on price action and market conditions.
Prediction
If the price holds above the deep retracement and liquidity buildup zones, expect upward movement toward the first target ( ₹145-₹150 ) and potentially the profit booking zone ( ₹149.30-₹156.33 ). A failure to sustain above these zones may result in testing the lower support zone ( ₹75-₹84 ).
Educational Insights
Wave Analysis: Wave C completion often signals the end of corrections in Elliott Wave Theory.
Fibonacci Retracement: Key retracement levels align with important support/resistance.
Liquidity Zones: Monitoring these zones can identify breakout/breakdown points.
Risk Management: Proper stop loss placement minimizes risk. Adjusting targets dynamically ensures better risk/reward.
Disclaimer: Trading involves risks. Conduct your own research or consult a financial advisor before making decisions. 📊✨
ARCHIDPLY trade ideas

50 SMA Rising- Positional TradeDisclaimer: I am not a Sebi registered adviser.
This Idea is publish purely for educational purpose only before investing in any stocks please take advise from your financial adviser.
Its 50 SMA Rising Strategy. Suitable for Positional Trading Initial Stop loss lowest of last 2 candles and keep trailing with 50 days SMA if price close below 50 SMA then Exit or be in the trade some time trade can go for several months.
Be Discipline because discipline is the Key to Success in the STOCK Market.
Trade What you see not what you Think

archid ply inds.Marketplace industry has given a break out of previous 52 week high and with a good volume its now works at 4 all time high although it can take some kind of refreshments at some point
Archidply (Swing):Archidply (Swing):
Getting support across a major demand zone.
Time to look for a swing opportunity here.
One can expect a minimum 65-75% gains.
Add positions while script rovers around 60-70.
Appropriate resistances/targets are highlighted.
Note: Do your own due diligence before taking any action.
I would be posting updates for this chart in the comments sections as time progresses.
Feel free to raise your queries.

ARCHIDPLYARCHIDPLY for long term Investment, seems good for Long from here .. Target, SL clearly given in chart
***I am not SEBI Registered. All my charts and analysis are only for educational purpose not for trading purpose.

Important Resistance BreakoutPlease look into the chart for a detailed understanding.
Consider these for short-term & swing trades with 2% profit.
For BTST trades consider booking
target for 1% - 2%
Please consider these ideas for educational purpose
Comment below if you are looking for any answers.

ARCHIDPLY sqeezimng for some goodness?!?!?!200ema seems as a good support!
If we manage to break above the 100ema, RS.90 can be the target!
Above 90, use 200ema as the tsl!

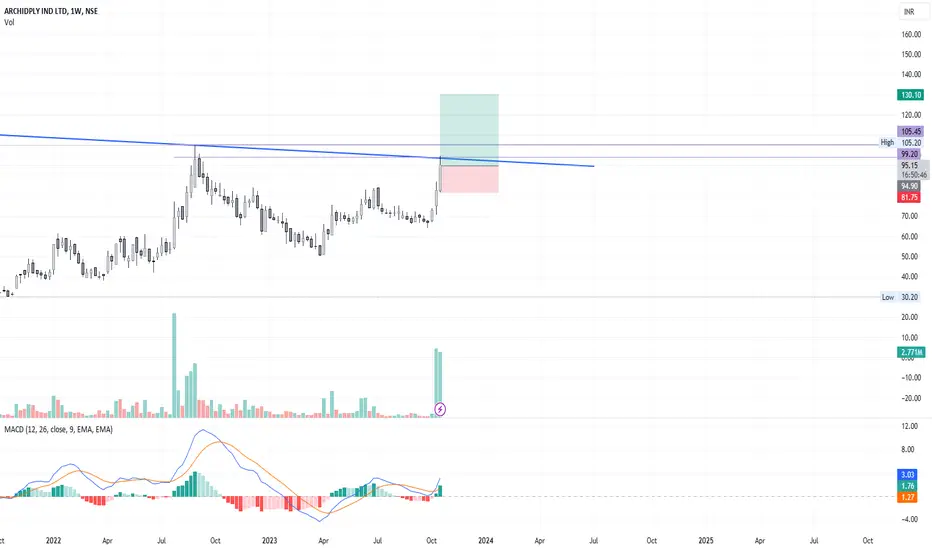
#ArchidplyBreakout yesterday on weekly.
Three more days to go yet for the week.
Huge volume yesterday.
I am placing 25% buy @ box top around 62
RS is good
false bar on stochastic on top
Elliott wave oscillator (5,35) is green

ARCHIDPLY👁️👁️ ARCHIDPLY.... CMP 65.20....COULD BE A GOOD GAINER IN COMMIING DAYS.... i m not sebt regt analyst...post is only for educational purpose...before taking any position pls consult ur financial advisor.

ARCHIRPLY NSE BULLISHVIEW ABOVE 61 CMP 63.8ARCHIRPLY NSE is bullish if 61 holds. NEW 52WEEK High. Fresh Breakout. Positive Trend.
Disclaimer: Educational Purpose Only. Not Buy Sell Reco . Not Sebi Registered.

ARCHIDPLY INDUSTRIESBSE:ARCHIDPLY
Trend seems to be changing after long time , looking for ATH , can look to enter in pullback for favorable R:R


Archidply - LongArchidply CMP - 42.20
Looking bullish in higher time frame. One can go for Swing / Short Term Trade setup with the following entry, exit & targets
Buy range 41 - 44 / Stop Loss 35
Target 1 - 50
Target 2 - 55
Target 3 – 60 / 70
Disclaimer: This is my view and for educational purpose only.

Reverse Head & Shoulder Paattern FormationA Reverse Head & Shoulder Pattern has taken place in Archid ply. if it breaks the resistance line with volumes then a clear indication of breakout
