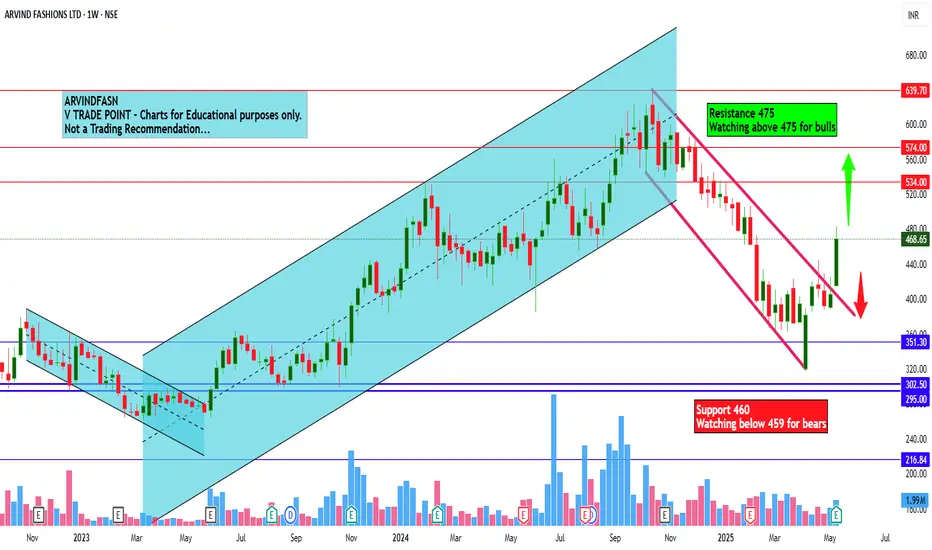
Arvind Fashions Ltd view for Intraday 19th May #ARVINDFASN Arvind Fashions Ltd view for Intraday 19th May #ARVINDFASN
Resistance 475 Watching above 475 for upside momentum.
Support area 460 Below 465 ignoring upside momentum for intraday
Watching below 459 for downside movement...
Above 465 ignoring downside move for intraday
Charts for Educational purposes only.
Please follow strict stop loss and risk reward if you follow the level.
Thanks,
V Trade Point
ARVINDFASN trade ideas
ARVINDFASN : Ready to Ride Wave 5 to New Highs
Price Action Overview:
Current price: ₹532.15 , trading within the Wave 4 completion zone ( ₹526–₹570 ) as per Elliott Wave analysis.
A deep retracement zone is identified between ₹495–₹505 , aligning with Wave C completion, where a bullish reversal is expected.
Wave C indicates a strong potential low point for the next bullish leg (Wave 5).
Key Levels:
Wave 4 Completion Zone: ₹526–₹570
Expected reversal area for Wave 5.
Deep Retracement Zone (Wave C): ₹495–₹505
Secondary buying opportunity if the price drops further.
Stop Loss: ₹486.40
Hourly close below this level invalidates the trade setup.
First Target Zone: ₹605–₹613
Logical resistance area for profit booking.
Second Target Zone: ₹654–₹671
Higher-level target as Wave 5 progresses.
Trading Strategy:
Entry Plan:
Initiate a buy near the Wave 4 completion zone ( ₹526–₹570 ) after bullish confirmation (e.g., bullish candlestick patterns or volume increase).
Consider a secondary buy within the deep retracement zone ( ₹495–₹505 ), aligning with Wave C completion.
Stop Loss:
Place a stop loss below ₹486.40 to minimize risk.
Profit Target:
First target: ₹605–₹613 .
Second target: ₹654–₹671 for extended profits as Wave 5 progresses.
Risk Management:
Scale into the trade cautiously to ensure favorable risk-reward ratios.
Keep an eye on broader market trends, as a bearish environment can invalidate this setup.
Potential Risks:
Failure to sustain demand in the Wave C or Wave 4 zones can lead to a deeper correction.
Broader market sentiment and sector trends may influence price movement.
Disclaimer:
This analysis is for educational purposes only. I am not a SEBI-registered analyst. Please conduct your research or consult a financial advisor before trading.
#ArvindFashions #TechnicalAnalysis #ElliottWave #Wave5 #SwingTrading #StockMarket #TradingStrategy #InvestmentPlanning #MarketInsights #StocksToWatch #BSE #NSE #Fibonacci

SWING IDEA - ARVINDFASNPrice has retested successfully at long time gap zone and has bounced multiple times at same point.
Stock is also making a parabolic formation since start of 2024.
Also near 52W High.
Also the following could take the stock to new highs in the coming weeks.
Q4 CONS NET PROFIT 243M RUPEES VS 109M (YOY)
EBITDA 1.35B RUPEES VS 1.13B (YOY)

Looking very strong for shrot termStock is strong in bigger timeframes and small Timeframe is showing a support.
which indicate stock can achieve a good return in short term.
Todays price: 608
Stoploss: 566
Target: 802
Good risk reward
Disclaimer: This idea is for personal learning and no buy or sell recommendation.

Darvas Box Strategy - Breakout StockDisclaimer: I am Not SEBI Registered adviser, please take advise from your financial adviser before investing in any stocks. Idea here shared is for education purpose only.
Stock has given break out. Keep this stock in watch list.
Buy above the High and do not forget to keep stop loss best suitable for swing trading.
Target and Stop loss Shown on Chart. As stop loss is Big Risk to reward Ratio / Target - 1:1.
Be Discipline, because discipline is the key to Success in Stock Market.
Trade what you See Not what you Think.

ARVNDFASN Showing reversal signals from Support.Aravind Fashion, the stock was ranging around its ipo price after breakout. Now the stock is retesting the levels and at a small trend line support. Expecting a reversal from bottom.

Buy Arvindfasn above 338 Target 425/480/540 avg@260 sl below 22The stock is making the cup & handle pattern with a bullish outlook and volume. Also fundamentally the company is reducing debt and currently the demand for apparels can see a surge with increased prices due to commodity cycle and energy crisis through upcoming winter season. Overall the stock is bullish.

Ramp Walk REMO stealing the show - Arvind FashionsArvind Fashions is doing Bold Ramp Walk :)
On Weekly - we see Double Bottom Pattern, Followed by Flag Pole - All Breakouts powerful and successful and heading to defined targets steadily
Target 1 - 517 (Reached)
Target 2 - 531
Target 3 - 640
Target 4 - 700
Target 5 - 780
As part of the Budget there is incentives for Textile industry and we expect strong upside on many Textile Stocks and Arvind Fashions on Technical Chart is having a Powerful structure to grow much higher
Keep Holding your Winners
Disclaimer:
Stocks-n-Trends is NOT a SEBI registered company. We do not provide Buy / Sell recommendations - rather we provide detailed analysis of how to review a chart, explain multi--timeframe views purely for Educational Purposes. We strongly suggest our followers to "Learn to Ride the Tide" and consult your Financial Advisors before taking any positions.
If you like our detailed analysis, please do rate us with your Likes, Boost and share your comments
-Team Stocks-n-Trends

ARVINDFASNARVINDFASN
weekly timeframe
i just shared my experience it is not an invite or recommendation to trade.
if youn any doubt means Please leave comments for any query.
best wishes
DYSON

Arvind Fashion has been given a strong breakoutArvind Fashion has been given a strong breakout on daily chart
Company has delivered good profit growth of 59.9% CAGR over last 5 years
FII's Are Increasing their stake.

Breakout with increase in volume
There is an breakout with increase in volume. Maybe stock is getting ready for a new trend. At around 370-380 is a good level to have a stock in portfolio.

Mid to long term bullish setup in #arvindfasnA long bullish VCP setup is being formed in Arvindfasn.
Stock has been consolidating for 2 years now.
FII's have doubled their stakes since 2020.

Stock at break up level This stock
When it sustain 390 level above it will touch life time High level so participate in rally by adding small small portion
My Target 500+
No recommendation for buy and sell
Take own analysis or SEBI registration advice
No responsibility from my side for profit or loss
I'm not recommending to participate in rally just education purpose

ARVINDFASN - 2 years ASCENDING TRIANGLE══════════════════════════════
Since 2014, my markets approach is to spot
trading opportunities based solely on the
development of
CLASSICAL CHART PATTERNS
🤝Let’s learn and grow together 🤝
══════════════════════════════
Hello Traders ✌
After a careful consideration I came to the conclusion that:
- it is crucial to be quick in alerting you with all the opportunities I spot and often I don't post a good pattern because I don't have the opportunity to write down a proper didactical comment;
- since my parameters to identify a Classical Pattern and its scenario are very well defined, many of my comments were and would be redundant;
- the information that I think is important is very simple and can easily be understood just by looking at charts;
For these reasons and hoping to give you a better help, I decided to write comments only when something very specific or interesting shows up, otherwise all the information is shown on the chart.
Thank you all for your support
🔎🔎🔎 ALWAYS REMEMBER
"A pattern IS NOT a Pattern until the breakout is completed. Before that moment it is just a bunch of colorful candlesticks on a chart of your watchlist"
═════════════════════════════
⚠ DISCLAIMER ⚠
The content is The Art Of Charting's personal opinion and it is posted purely for educational purpose and therefore it must not be taken as a direct or indirect investing recommendations or advices. Any action taken upon these information is at your own risk.

Arvind Fashion ready for next leg of rally?348-352 was a long term resistance. The price broke the resistance, gave a good break out, and now restesting the older resistance. If it successfully bounces off from here, there's a good upside potential.

Buy ARVIND FASHIONSBuy Arvind fashions if get closing day candle above trendline for a target of 35%

ARVIND FASION LTD SWING TRADELooks good for swing trade, market is to much volatile take trade accordingly.
in this trade Stop loss is big but rewords are also big, it has made a beautiful pattern and today it has given BO.
A swing trade can be taken.
DISCLIMER: This chart is just for educational purpose.


Arvind Fashion pvt. LtdProper create a POLL an FLAG pattern and confirm the retest
So.. perfect time to enter this stock Before our risk management 👍

Arvind FashionsArvind Fashions LTD
Good uptrend
RSI - 64 Levels - Good time to enter
Target: 352
Support levels are given below
310 & 294
Like & follow
Happy trading :)


BO from wedgeThis stock has fallen from the highs of 800 to 201 now.. it has started moving up again, but let's see how much it moves....based purely on technical analysis expect some upside... CMP - 201. 238 is the first target....it is a very small cap so be cautious....this is not a recommendation to buy or sell.
