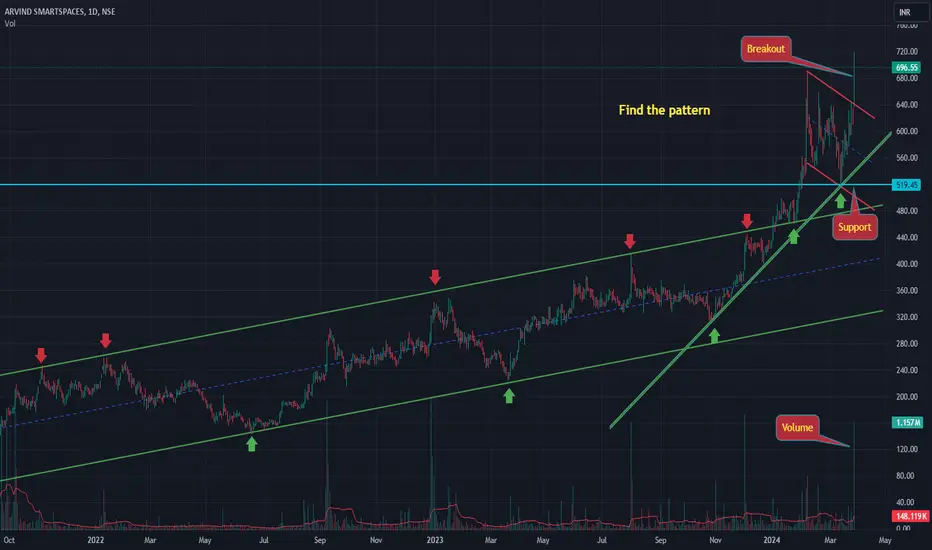
ARVIND SMARTSPACES LTD S/RSupport and Resistance Levels:
Support Levels: These are price points (green line/shade) where a downward trend may be halted due to a concentration of buying interest. Imagine them as a safety net where buyers step in, preventing further decline.
Resistance Levels: Conversely, resistance levels (red line/shade) are where upward trends might stall due to increased selling interest. They act like a ceiling where sellers come in to push prices down.
Breakouts:
Bullish Breakout: When the price moves above resistance, it often indicates strong buying interest and the potential for a continued uptrend. Traders may view this as a signal to buy or hold.
Bearish Breakout: When the price falls below support, it can signal strong selling interest and the potential for a continued downtrend. Traders might see this as a cue to sell or avoid buying.
MA Ribbon (EMA 20, EMA 50, EMA 100, EMA 200) :
Above EMA: If the stock price is above the EMA, it suggests a potential uptrend or bullish momentum.
Below EMA: If the stock price is below the EMA, it indicates a potential downtrend or bearish momentum.
Trendline: A trendline is a straight line drawn on a chart to represent the general direction of a data point set.
Uptrend Line: Drawn by connecting the lows in an upward trend. Indicates that the price is moving higher over time. Acts as a support level, where prices tend to bounce upward.
Downtrend Line: Drawn by connecting the highs in a downward trend. Indicates that the price is moving lower over time. It acts as a resistance level, where prices tend to drop.
Disclaimer:
I am not SEBI registered. The information provided here is for learning purposes only and should not be interpreted as financial advice. Consider the broader market context and consult with a qualified financial advisor before making investment decisions.
ARVSMART trade ideas

Darvas Box Strategy - Break out Stock - Swing TradeDisclaimer: I am Not SEBI Registered adviser, please take advise from your financial adviser before investing in any stocks. Idea here shared is for education purpose only.
Stock has given break out. Buy above high. Keep this stock in watch list.
Buy above the High and do not forget to keep stop loss, best suitable for swing trading.
Target and Stop loss Shown on Chart. Risk to Reward Ratio/ Target Ratio 1:2
Stop loss can be Trail when it make new box / Swing.
Be Discipline, because discipline is the key to Success in Stock Market.
Trade what you See Not what you Think.

ARVIND SMARTSPACES BRAKEOUT gives brake out on daily chart.NSE:ARVSMART
ARVIND SMARTSPACES BRAKEOUT gives brake out on daily chart.
I am buying this stock
Near 762
And follow sl on 650
My target will be 870,1000
My risk reward ratio is 1:2
Return on capital 20%+

ARVSMART1. Anything can happen.
2. You don't need to know what is going to happen next in order to make money.
3. There is a random distribution between wins and losses for any given set of variables that define an edge. No other thoughts
4. An edge is nothing more than an indication of a higher probability of one thing happening over another.
5. Every moment in the market is unique.

Arvind SmartSpaces Ltd. Bullish MomentumSeems a good bet for momentum trading
Broke previous resistance, Volume started building
RSI below at 67%
This counter could reach 748, 756 , 761 . Can deploy 10% capital at current price and a dip towards 730 can buy more.
Maintain stop loss of 718 on daily closing basis.
Strength
• Strong Momentum: Price above short, medium and long term moving averages
• Rising Net Cash Flow and Cash from Operating activity
• Company with high TTM EPS Growth
• Strong Annual EPS Growth
• Good quarterly growth in the recent results
• Growth in Net Profit with increasing Profit Margin (QoQ)
• Growth in Quarterly Net Profit with increasing Profit Margin (YoY)
• Company with Low Debt
• Increasing Revenue every quarter for the past 3 quarters
• Increasing profits every quarter for the past 3 quarters
• Annual Net Profits improving for last 2 years
• Book Value per share Improving for last 2 years
• Company with Zero Promoter Pledge
• FII / FPI or Institutions increasing their shareholding
• Near 52 Week High
Weakness
• MFs decreased their shareholding last quarter.
Opportunities
• Positive Breakout Third Resistance ( LTP > R3)
• Highest Recovery from 52 Week Low
• High Volume, High Gain
Threats
• Promoter decreasing their shareholding
• High PE (PE > 40)
www.tradingview.com
View is for Study purpose not from sebi registered research analyst.

ARVSMARTStock name = Arvind Smartspaces Limited.
Daily chart setup
Chart is self explanatory. Levels of breakout, possible up-moves (where stock may find resistances) and support (close below which, setup will be invalidated) are clearly defined.
Master Score - A
Disclaimer: This is for demonstration and educational purpose only. this is not buying and selling recommendations. I am not SEBI registered. please consult your financial advisor before taking any trade.

💥Arvind Smartspaces💥-Nice Breakout💥Arvind Smartspaces💥-Nice Breakout
Capital to be deployed- 20k
Investing Price-440-450
Breakout Price-432
Stoploss-377
Targets-590-769-852
RT for max reach
#arvindsmartspace #stockstowatch #StocksToBuy #StocksInFocus #stocks #StockMarket


💥Arvind Smart Spaces💥-Nice Breakout💥Arvind Smart Spaces💥-Nice Breakout
Capital to be deployed- 20k
Investing Price-432
Breakout Price-432
Stoploss-341
Targets-590-769
RT for max reach
#arvindsmartspaces #stockstowatch #StocksToBuy #StocksInFocus #stocks #StockMarket

Arvind SmartSpaceThe stock broke out of the 4-month consolidation with huge volumes towards the end of 2022. Now, it seems to be retesting the breakout post which it is bouncing off the key EMAs.
Going long @317.5 with an SL of 310.
If one is more of a medium-term player, then one can keep a wider SL of 299.

ARVSMART - Breakout after consolidation Long setupAs per price action, you can see clearly it has given a breakout with volume after 5 months of consolidation. So the probability is high to keep momentum and price go up by around 10%. according to my analysis entry should be above @325 and for reward wait to touch 10-15%.
Entry Price:- Above @ 325
Stop Loss:- below @299
Target:- 10-15%

#ARVSMART #DBL #IRB #Cnxinfra #stockstowatch #tradingtips #nifty#ARVSMART
to break all-time high
NSE: ARVSMART
CMP: 276.45
TARGET: 325
SL: 240
RR: >1.5 times
Timeframe: <6M
Factors:
BULLISH WEDGE BREAKOUT
Trend Following
Rising Volume with rising Prices.
Flag pattern breakout.
Pennant Pattern Breakout with Bullish Candle.
Retest Successful.
Higher Highs & Higher Lows.
Broken above RESISTANCE levels
Trading at SUPPORT levels
Earnings are strong.
Bullish Wedge Breakout
Risk Return Ratio is healthy.
And
Rising from Double Bottom Pattern to Flag Pattern forming.
If you like my work KINDLY LIKE SHARE & FOLLOW this page for free Stock Recommendations.
With 💚 from Rachit Sethia

ARVSMART -Arvind Smart Spaces -High Volume Node Area Transition1) Since 17 October 2021 to Till date, if we study on volume profiler, we find the stock near to transition area point.
2) 225 is the decisive area, once it is taken-out decisively, we can expect good transitioning movement.
3) In the 235 area, we may face supply and then may see a pullback to 225 area.
4) We can use the pitchfork, to track the movement and multiple pullback entry opportunities.
Let's see when stock gives transition breakout entry!

Long Arvind smartspacesGood breakout of inverse head and shoulder with increasing volume.
Can long for new ATH.
Do your own research before #investing. For education purpose only🤞🏻🧿


