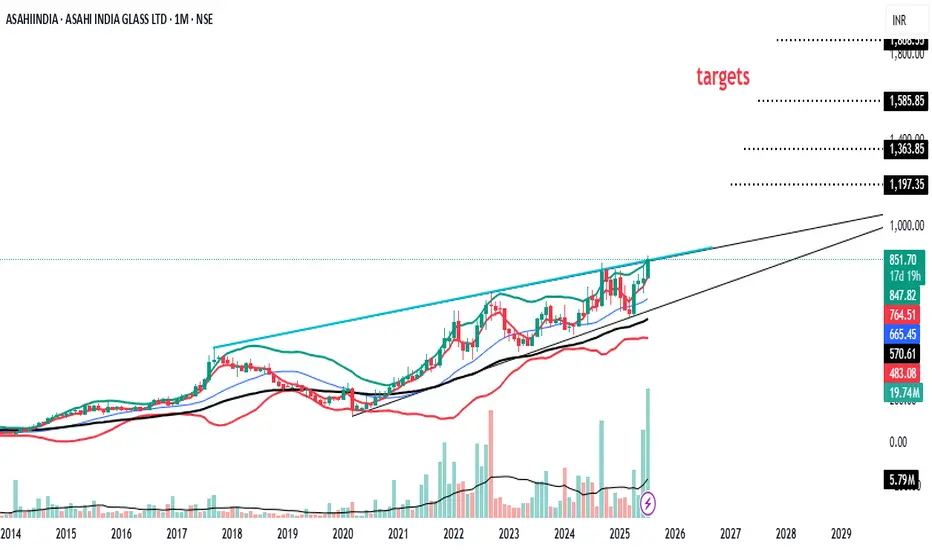
Asahiindia, Kindly do your own studyThis stock has given all time high breakout.
Monthly MACD turn positive
Monthly, weekly and Daily time frame are in momentum
ASAHIINDIA trade ideas
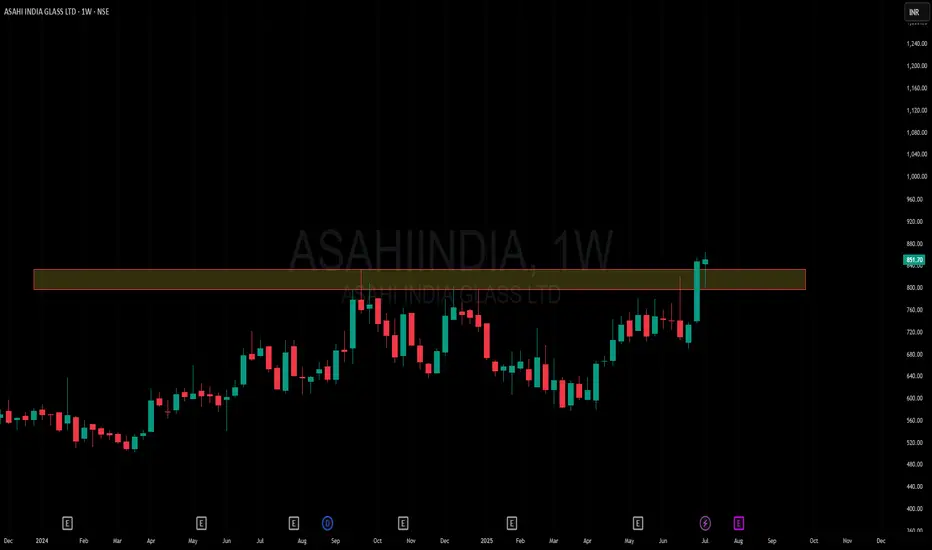
Amazing breakout on WEEKLY Timeframe - ASAHIINDIACheckout an amazing breakout happened in the stock in Weekly timeframe, macroscopically seen in Daily timeframe. Having a great favor that the stock might be bullish expecting a staggering returns of minimum 25% TGT. IMPORTANT BREAKOUT LEVELS ARE ALWAYS RESPECTED!
NOTE for learners: Place the breakout levels as per the chart shared and track it yourself to get amazed!!
#No complicated chart patterns
#No big big indicators
#No Excel sheet or number magics
TRADE IDEA: WAIT FOR THE STOCK TO BREAKOUT IN WEEKLY TIMEFRAME ABOVE THIS LEVEL.
Checkout an amazing breakout happened in the stock in Weekly timeframe.
Breakouts happening in longer timeframe is way more powerful than the breakouts seen in Daily timeframe. You can blindly invest once the weekly candle closes above the breakout line and stay invested forever. Also these stocks breakouts are lifelong predictions, it means technically these breakouts happen giving more returns in the longer runs. Hence, even when the scrip makes a loss of 10% / 20% / 30% / 50%, the stock will regain and turn around. Once they again enter the same breakout level, they will flyyyyyyyyyyyy like a ROCKET if held in the portfolio in the longer run.
Time makes money, GREEDY & EGO will not make money.
Also, magically these breakouts tend to prove that the companies turn around and fundamentally becoming strong. Also the magic happens when more diversification is done in various sectors under various scripts with equal money invested in each N500 scripts.
The real deal is when to purchase and where to purchase the stock. That is where Breakout study comes into play.
Check this stock which has made an all time low and high chances that it makes a "V" shaped recovery.
> Taking support at last years support or breakout level
> High chances that it reverses from this point.
> Volume dried up badly in last few months / days.
> Very high suspicion based analysis and not based on chart patterns / candle patterns deeply.
> VALUABLE STOCK AVAILABLE AT A DISCOUNTED PRICE
> OPPURTUNITY TO ACCUMULATE ADEQUATE QUANTITY
> MARKET AFTER A CORRECTION / PANIC FALL TO MAKE GOOD INVESTMENT
DISCLAIMER : This is just for educational purpose. This type of analysis is equivalent to catching a falling knife. If you are a warrior, you throw all the knives back else you will be sorrow if it hits SL. Make sure to do your analysis well. This type of analysis only suits high risks investor and whose is willing to throw all the knives above irrespective of any sectoral rotation. BE VERY CAUTIOUS AS IT IS EXTREME BOTTOM FISHING.
HOWEVER, THIS IS HOW MULTIBAGGERS ARE CAUGHT !
STOCK IS AT RIGHT PE / RIGHT EVALUATION / MORE ROAD TO GROW / CORRECTED IV / EXCELLENT BOOKS / USING MARKET CRASH AS AN OPPURTUNITY / EPS AT SKY.
LET'S PUMP IN SOME MONEY AND REVOLUTIONIZE THE NATION'S ECONOMY!
ASAHI INDIA GLASS- Bullish Flag & Pole Breakout (Daily T/F)Trade Setup
📌 Stock: ASAHI INDIA GLASS ( NSE:ASAHIINDIA )
📌 Trend: Strong Bullish Momentum
📌 Risk-Reward Ratio: 1:3 (Favorable)
🎯 Entry Zone: ₹851.00 (Breakout Confirmation)
🛑 Stop Loss: ₹809.00 (Daily Closing Basis) (-5 % Risk)
🎯 Target Levels:
₹875.10
₹897.85
₹920.90
₹945.65
₹969.00.00 (Final Target)
Technical Rationale
✅ Bullish Flag & Pole Breakout - Classic bullish pattern confirming uptrend continuation
✅ Strong Momentum - Daily RSI > 60, Weekly RSI >60 Monthly rsi >60
✅ Volume Confirmation - Breakout volume 121.30K vs previous day's 1.63M
✅ Multi-Timeframe Alignment - Daily and weekly charts showing strength
Key Observations
• The breakout comes with significantly higher volume, validating strength
• Well-defined pattern with clear price & volume breakout
• Conservative stop loss at recent swing low
Trade Management Strategy
• Consider partial profit booking at each target level
• Move stop loss to breakeven after Target 1 is achieved
• Trail stop loss to protect profits as price progresses
Disclaimer ⚠️
This analysis is strictly for educational purposes and should not be construed as financial advice. Trading in equities involves substantial risk of capital loss. Past performance is not indicative of future results. Always conduct your own research, consider your risk appetite, and consult a financial advisor before making any investment decisions. The author assumes no responsibility for any trading outcomes based on this information.
What do you think? Are you watching NSE:ASAHIINDIA for this breakout opportunity? Share your views in the comments!

ASAHIINDIAASAHIINDIA has given symmetrical triangle breakout with unusual volume. Already took a momentum. Now as long as it is above upper channel line, i believe the momentum will continue till 980-1000 levels. Keep it on radar.

Trade Alert: ASAHI INDIA GLASS LTD (NSE: ASAHIINDIA)🚨 Trade Alert: ASAHI INDIA GLASS LTD (NSE: ASAHIINDIA) 🚨
Best Entry: ₹730
📉 Support Zone: ₹660-₹720
📈 Target: ₹940 (28.6% Upside)
🛑 Stop Loss: ₹655
🔸Risk/Reward Ratio: 2.79
⏳ Timeframe: 3 Months
🔍 Solid support, ready for breakout! #NSE #StockMarket #ASAHIINDIA #GlassSector #StockTrading #IndianStocks #TechnicalAnalysis #Bullish #Multibagger #SwingTrading #RiskReward #BreakoutAlert #WealthCreation #InvestingIndia
Logic of the Trade:
Entry Zone:
The chart indicates a best entry price of ₹730 or higher. The stock has recently bounced back from the support zone of ₹660-₹720, suggesting this level is where buyers are stepping in. It's a potential breakout area after consolidation.
Support Zone:
The ₹660-₹720 range acts as a solid support zone, holding the price from further decline. This level has been tested multiple times, reinforcing its strength.
Target:
A price target of ₹940 is projected based on previous highs and potential breakout strength. This level represents a 28.6% upside from the current price.
Stop Loss:
The stop loss is set at ₹655, just below the support zone, limiting downside risk to around 10%. If the stock breaks below this, it would invalidate the bullish setup.
Risk/Reward Ratio:
With a risk of 10.2% (from ₹730 entry to ₹655 stop) and a reward of 28.6%, the Risk/Reward ratio of 2.79 is favorable, making this trade attractive for swing traders.
Time Frame:
The anticipated time frame to reach the target is around 3 months, based on past price action and market momentum.
Technical Indicators:
The chart shows a clear price consolidation near support, along with a potential breakout from the current price levels.
An upward trendline shows the overall bullish movement despite temporary corrections.
This setup is ideal for swing traders looking for a mid-term trade with a well-defined risk-reward structure.

ASAHI INDIA GLASS LTD S/R Support and Resistance Levels:
Support Levels: These are price points (green line/shade) where a downward trend may be halted due to a concentration of buying interest. Imagine them as a safety net where buyers step in, preventing further decline.
Resistance Levels: Conversely, resistance levels (red line/shade) are where upward trends might stall due to increased selling interest. They act like a ceiling where sellers come in to push prices down.
Breakouts:
Bullish Breakout: When the price moves above resistance, it often indicates strong buying interest and the potential for a continued uptrend. Traders may view this as a signal to buy or hold.
Bearish Breakout: When the price falls below support, it can signal strong selling interest and the potential for a continued downtrend. Traders might see this as a cue to sell or avoid buying.
20 EMA (Exponential Moving Average):
Above 20 EMA(50 EMA): If the stock price is above the 20 EMA, it suggests a potential uptrend or bullish momentum.
Below 20 EMA: If the stock price is below the 20 EMA, it indicates a potential downtrend or bearish momentum.
Trendline: A trendline is a straight line drawn on a chart to represent the general direction of a data point set.
Uptrend Line: Drawn by connecting the lows in an upward trend. Indicates that the price is moving higher over time. Acts as a support level, where prices tend to bounce upward.
Downtrend Line: Drawn by connecting the highs in a downward trend. Indicates that the price is moving lower over time. It acts as a resistance level, where prices tend to drop.
RSI: RSI readings greater than the 70 level are overbought territory, and RSI readings lower than the 30 level are considered oversold territory.
Combining RSI with Support and Resistance:
Support Level: This is a price level where a stock tends to find buying interest, preventing it from falling further. If RSI is showing an oversold condition (below 30) and the price is near or at a strong support level, it could be a good buy signal.
Resistance Level: This is a price level where a stock tends to find selling interest, preventing it from rising further. If RSI is showing an overbought condition (above 70) and the price is near or at a strong resistance level, it could be a signal to sell or short the asset.
Disclaimer:
I am not a SEBI registered. The information provided here is for learning purposes only and should not be interpreted as financial advice. Consider the broader market context and consult with a qualified financial advisor before making investment decisions.

Asahi India Glass Ltd Swing Trade – VCP Breakout with VolumeOverview:
Asahi India Glass Ltd (NSE: ASAHIINDIA) has recently broken out above the key resistance level of INR 715, confirming a Volatility Contraction Pattern (VCP) breakout. With the current price trading at INR 761, this offers a promising swing trade opportunity for traders looking to capture the bullish momentum that has emerged post-breakout.
Technical Analysis:
VCP Breakout:
Asahi India Glass Ltd has been forming a VCP (Volatility Contraction Pattern), characterized by a series of tightening price ranges with diminishing pullbacks, indicating reduced selling pressure and increased demand.
The breakout above INR 715, confirmed by high volume, marks the end of the consolidation phase, signaling that the stock is primed for upward movement and is an attractive entry for swing traders.
Moving Averages:
The stock is currently trading well above both the 50-day and 200-day moving averages, which have shown steady upward inclines. This indicates the stock is in a well-defined uptrend, offering further confirmation of the bullish setup.
A notable spike in volume accompanied the breakout above INR 715, which is a key indicator of buying interest and institutional participation. Sustained higher volume following the breakout suggests continued buying strength and further price increases.
Price Prediction:
Given the strength of the breakout and the bullish technical indicators, Asahi India Glass Ltd has potential upside toward INR 790 in the short term. If buying pressure continues, the stock could rally further to INR 820, making this an ideal opportunity for a swing trade.
Trade Plan:
Entry: Enter at the current price around INR 761, post-breakout confirmation above INR 715.
Stop-Loss: Set a stop-loss just below the breakout level at INR 710 to protect against a potential false breakout.
Target: First target at INR 790, with a secondary target at INR 820.
Risk/Reward:
The trade offers a favorable risk/reward ratio of approximately 3:1, providing a solid opportunity for traders to ride the post-VCP breakout momentum while managing risk with a disciplined stop-loss strategy.
This analysis presents a clear entry plan based on the recent VCP breakout of Asahi India Glass Ltd. You can use this idea for publication on TradingView, offering a detailed breakdown of the current technical setup and trade strategy! Special Thanks to Trade Experts Academy

Volume Breakout - Swing TradeDisclaimer: I am not a Sebi registered adviser.
This Idea is publish purely for educational purpose only before investing in any stocks please take advise from your financial adviser.
Volume Breakout. Stock has give Breakout with Volume. Keep in watch list. Buy above the high. Suitable for Swing Trade. Stop loss & Target Shown on Chart. Exit With in 5 to 10 Days
Be Discipline because discipline is the Key to Success in the STOCK Market.
Trade What you see not what you Think

ASAHIINDIA1. Anything can happen.
2. You don't need to know what is going to happen next in order to make money.
3. There is a random distribution between wins and losses for any given set of variables that define an edge. No other thoughts
4. An edge is nothing more than an indication of a higher probability of one thing happening over another.
5. Every moment in the market is unique.

ASAHIINDAsahiind
CMP 777
Weekly strong closing and breakout with volume
Above weekly high more upside possible

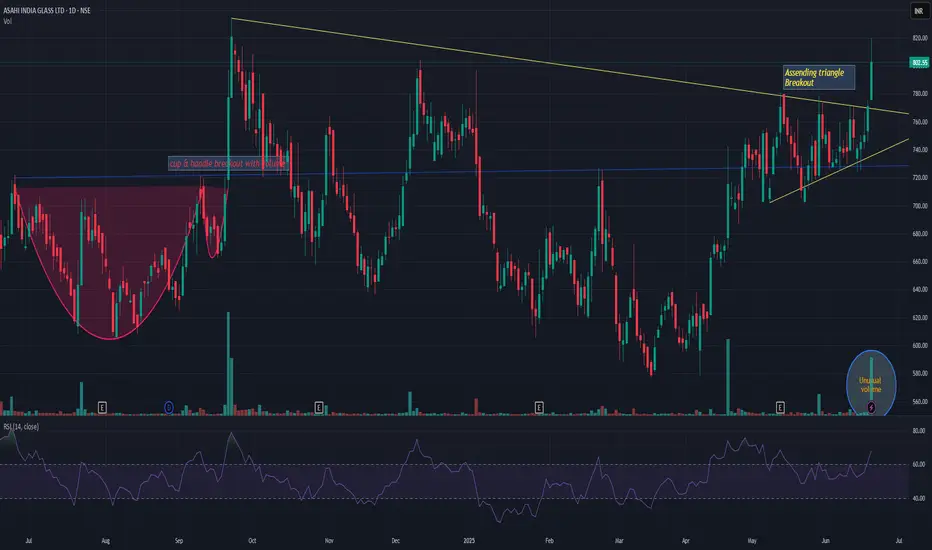
Cup and handle breakoutGood volume build up in daily as well as in weekly timeframe.
Breakout with good volume.
Fundamentals are OK.
DII stakes are up.
NOTE: I do my analysis, do yours before trade.

ASAHI INDIA GLASS LTDBreakout happend in this stock with rising 200dma and RS indicator is also showing strength.
Keep your risk and reward ratios according to your own preferance.
This is for educational purpose, do your own research before investing

Positional Trading Strategy On ASHAIINDIAEntry:
A breakout above the resistance level around ₹725 is likely to confirm the Cup and Handle pattern.
Consider entering the trade on a strong breakout above ₹725 with volume confirmation.
Target Price:
The height of the cup is from ₹480 to ₹725, giving a range of approximately ₹240.
Adding this range to the breakout level of ₹725, the first target could be around ₹960.
Stop Loss:
Place a stop loss slightly below the support level, around ₹680, which is near the handle of the cup pattern.
Risk-Reward Ratio:
Target Price: ₹960
Entry: ₹725
Stop Loss: ₹658
This setup provides a decent risk-reward ratio of approximately 5:1.
Additional Considerations:
Monitor the volume closely. The breakout should be accompanied by higher-than-average volumes to confirm the move.
Keep an eye on broader market sentiment and any relevant news regarding the stock or industry.
This strategy is for medium to long-term positional trading based on a technical pattern. Always ensure to review your risk management plan.


ASAHI GLASS INDIA GIVES BRAKEOUT ON DAILY CHARTNSE:ASAHIINDIA
Asahi glass India Gives brake out on daily chart.
Buy Near 650
Sl 590
Target 800+
Time duration 1-2 month
Risk Reward Ratio ---- 1 : 2.50
Profit on capital Ratio ---- 23%+

Triangle breakout on ASAHIINDIAASAHIINDIA formed a triangle patter on weekly chart and broke out of resistance today. Multiple support and resistance levels were tested prior to breakout. Also note the price tried to breakout few trading sessions back and was rejected. Upon going down the price was again rejected at the support levels. Indicating strong buying interest. Stop loss can be had just below the breakout candle with target the width of the triangle. Entry can be had above today's high. This trade offers ideal risk reward of 1:2.
Hope you like this idea. If you like please boost this idea or leave a comment below on what you think. Otherwise, happy trading :-).

lapu star breakoutA cup and handle price pattern on a security's price chart is a technical indicator that resembles a cup with a handle, where the cup is in the shape of a "u" and the handle has a slight downward drift.
The cup and handle is considered a bullish signal, with the right-hand side of the pattern typically experiencing lower trading volume. The pattern's formation may be as short as seven weeks or as long as 65 weeks.

Asahi waiting for the Volumes can be increased slowlyAsahi India Glass Ltd. CMP – 566.85
Market Capitalization Rs 13,779.6Cr
Red Flags:🟥
High Valuation (P.E. = 40.1)
Declining cash from operations annual
Green Flags:🟩
Low debt
FIIs are increasing stake
MFs are increasing stake
Improving annual net profit
Previous Happy Candles Number – 32/100
New Happy Candles Number – 57/100
Fresh Entry/ averaging / compounding after closing above 574
Targets: 589 and 607
Long term target: 627 and 651
Stop loss: Closing below 545
The above information is provided for educational purpose, analysis and paper trading only. Please don't treat this as a buy or sell recommendation for the stock. We do not guarantee any success in highly volatile market or otherwise. Stock market investment is subject to market risks which include global and regional risks. We will not be responsible for any Profit or loss that may occur due to any financial decision taken based on any data provided in this message.

📈 Asahi India Glass Limited📈 Asahi India Glass Limited Update 🚀
🎯 Target: Rs. 685
📌 Stock Analysis:
Asahi India Glass Limited (AIS) is showing strong potential for a target price of Rs. 685. The stock has been consistently finding support in the range of 605-610, indicating a solid foundation for potential gains.
📈 Technical Outlook:
With the stock holding steady in the support zone, it's a promising time for investors to consider an entry. Keep a close eye on AIS as it climbs towards the target price.
Disclaimer: Remember that investing in stocks carries risks, and it's important to do your own research or consult with a financial advisor before making any investment decisions. 📊💼 #StockAnalysis #InvestmentOpportunity #AIS #MarketUpdate

ASAHIINDIAASAHIINDIA Chart Analysis.......18/09/23
Long above 610
Sl : 565,
Target : 650 / 665 / 690
Enjoy !

Good upside can be seenAsahi India observe great Bullish engulfing pattern on daily time frame that too with exceptional volumes.
Now the stock is consolidating for few days, giving the good opportunity to enter at this price.
Target 700+
