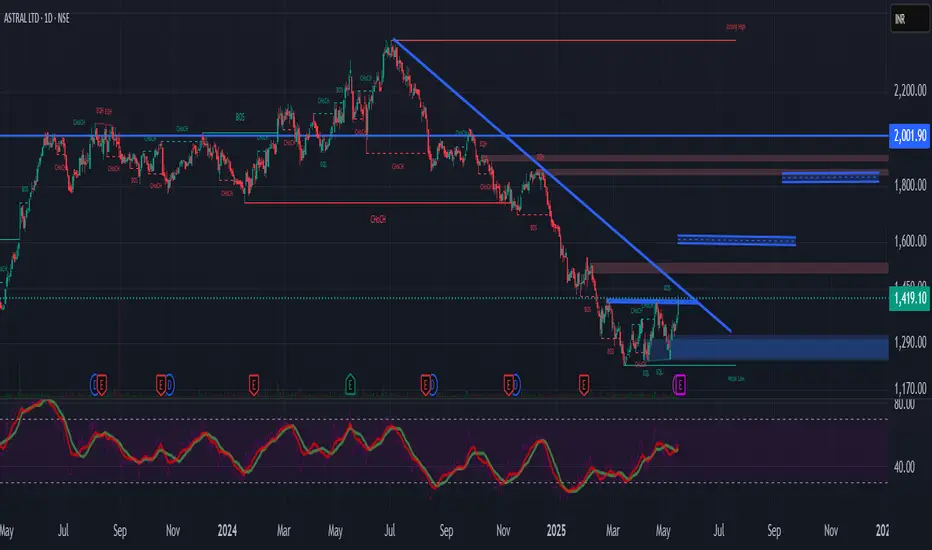
Astral_Price Rejection @ 200 Daily EMA_ ShortPrice rejection at 200 DEMA with Bearish Engulfing Pattern
Short when the risk (Entry Price to Stop Loss) is favorable.
Next report date
—
Report period
—
EPS estimate
—
Revenue estimate
—
19.50 INR
5.24 B INR
58.32 B INR
117.97 M
About ASTRAL LTD
Sector
Industry
CEO
Sandeep Pravinbhai Engineer
Website
Headquarters
Ahmedabad
Founded
1996
ISIN
INE006I01046
FIGI
BBG000MSSRF7
Astral Ltd. engages in manufacturing and marketing of plumbing and piping systems for both residential and industrial applications. It operates through the Plastic Products and Adhesives segments. The company was founded on March 25, 1996 and is headquartered in Ahmedabad, India.
Related stocks

Reversal Trade in ASTRAL1. Consolidation breakout
2. Positive Divergence on RSI
3. Volume pop up
4. MACD signal turning green
5. RSI near 70

ASTRAL Flag Pole BreakoutASTRAL Flag Pole Breakout
T1 - 58%
T2 - 213%
Breakout strategy seen with moderate Volume Increase

Review and plan for 22nd May 2025 Nifty future and banknifty future analysis and intraday plan.
Quarterly results.
This video is for information/education purpose only. you are 100% responsible for any actions you take by reading/viewing this post.
please consult your financial advisor before taking any action.
----Vinaykumar

astral ltd a good fundamentally strong stock with good technicalastral had formed a nice base and started upmove looks good for medium to long term

ASTRALStock is trading in exactly in Fibonacci retracement zone and with horizontal support in weekly timfraempossibility of reversals towards upward.

Cup & Handle Pattern Breakout - ASTRALTechnical Analysis:
Current Price: ₹1419 (as per the image)
Target 1: ₹1600 (based on small Cup & Handle breakout, potential 200 point return)
Target 2: ₹1850 (after Super Trendline breakout)
Timeframe: 1 to 3 months (for targets to be achieved)
Integrated Analysis:
Bullish Technica

ASTRAL LTD Buy opportunityThe price respecting significant support level around ₹1,200 - ₹1,300.
This indicates strong buying interest at these levels.
Wait for the breakout for less risk. I'm already long from here.

we can long on astral from the cmp 1343 2nd time retest the same level and we got small green candle on the given rangeof buyer area we can go long from here for the target of new high only for ling term view only we can consider
cmp - 1343
sl - 160 points from the the entry level
targe - new high from the swing level

See all ideas
Summarizing what the indicators are suggesting.
Neutral
SellBuy
Strong sellStrong buy
Strong sellSellNeutralBuyStrong buy
Neutral
SellBuy
Strong sellStrong buy
Strong sellSellNeutralBuyStrong buy
Neutral
SellBuy
Strong sellStrong buy
Strong sellSellNeutralBuyStrong buy
An aggregate view of professional's ratings.
Neutral
SellBuy
Strong sellStrong buy
Strong sellSellNeutralBuyStrong buy
Neutral
SellBuy
Strong sellStrong buy
Strong sellSellNeutralBuyStrong buy
Neutral
SellBuy
Strong sellStrong buy
Strong sellSellNeutralBuyStrong buy
Displays a symbol's price movements over previous years to identify recurring trends.
Frequently Asked Questions
The current price of ASTRAL is 1,440.20 INR — it has decreased by −2.20% in the past 24 hours. Watch ASTRAL LTD stock price performance more closely on the chart.
Depending on the exchange, the stock ticker may vary. For instance, on NSE exchange ASTRAL LTD stocks are traded under the ticker ASTRAL.
ASTRAL stock has fallen by −4.56% compared to the previous week, the month change is a −4.05% fall, over the last year ASTRAL LTD has showed a −33.81% decrease.
We've gathered analysts' opinions on ASTRAL LTD future price: according to them, ASTRAL price has a max estimate of 1,812.00 INR and a min estimate of 1,371.00 INR. Watch ASTRAL chart and read a more detailed ASTRAL LTD stock forecast: see what analysts think of ASTRAL LTD and suggest that you do with its stocks.
ASTRAL reached its all-time high on Jul 2, 2024 with the price of 2,454.00 INR, and its all-time low was 1.35 INR and was reached on Mar 13, 2009. View more price dynamics on ASTRAL chart.
See other stocks reaching their highest and lowest prices.
See other stocks reaching their highest and lowest prices.
ASTRAL stock is 2.85% volatile and has beta coefficient of 0.98. Track ASTRAL LTD stock price on the chart and check out the list of the most volatile stocks — is ASTRAL LTD there?
Today ASTRAL LTD has the market capitalization of 386.91 B, it has increased by 0.06% over the last week.
Yes, you can track ASTRAL LTD financials in yearly and quarterly reports right on TradingView.
ASTRAL LTD is going to release the next earnings report on Aug 8, 2025. Keep track of upcoming events with our Earnings Calendar.
ASTRAL earnings for the last quarter are 6.70 INR per share, whereas the estimation was 6.51 INR resulting in a 2.86% surprise. The estimated earnings for the next quarter are 5.02 INR per share. See more details about ASTRAL LTD earnings.
ASTRAL LTD revenue for the last quarter amounts to 16.81 B INR, despite the estimated figure of 17.28 B INR. In the next quarter, revenue is expected to reach 14.70 B INR.
ASTRAL net income for the last quarter is 1.79 B INR, while the quarter before that showed 1.14 B INR of net income which accounts for 57.14% change. Track more ASTRAL LTD financial stats to get the full picture.
EBITDA measures a company's operating performance, its growth signifies an improvement in the efficiency of a company. ASTRAL LTD EBITDA is 9.46 B INR, and current EBITDA margin is 16.22%. See more stats in ASTRAL LTD financial statements.
Like other stocks, ASTRAL shares are traded on stock exchanges, e.g. Nasdaq, Nyse, Euronext, and the easiest way to buy them is through an online stock broker. To do this, you need to open an account and follow a broker's procedures, then start trading. You can trade ASTRAL LTD stock right from TradingView charts — choose your broker and connect to your account.
Investing in stocks requires a comprehensive research: you should carefully study all the available data, e.g. company's financials, related news, and its technical analysis. So ASTRAL LTD technincal analysis shows the sell today, and its 1 week rating is sell. Since market conditions are prone to changes, it's worth looking a bit further into the future — according to the 1 month rating ASTRAL LTD stock shows the sell signal. See more of ASTRAL LTD technicals for a more comprehensive analysis.
If you're still not sure, try looking for inspiration in our curated watchlists.
If you're still not sure, try looking for inspiration in our curated watchlists.