BREAKOUT BUY TRADE ASTRALBreakout at all time high. All the buy levels with SL and Target are mentioned in Chart.
ASTRAL trade ideas

Astral breaking out Astral breaking out of long term ascending triangle, moving in a channel.
Short term targets 2575, 2900.
SL 1900

Breakout in Astral10-05
The candle made is a strong bullish candle which is attempted breakout.
can buy with open targets
#educational purpose only


My view on AstralAstral forming
Head & Shoulder pattern
Looking weak below 1940-45
Tgt looking 1900-1880-1850++
in very short term
Keeping on radar Astral 1960 PE

AstralAstral Poly Technik Ltd was established in 1996, with the aim to manufacture pro-India plumbing and drainage systems in the country. It has also forayed into adhesive business over years.
Fundamentally good counter to go for long-term
Technically - Wait for breakout from INVERSE HEAD and SHOULDER PATTERN , TARGETS and STOP LOSS MENTIONED in CHART
Market Cap
₹ 38,882 Cr.
Current Price
₹ 1,448
Stock P/E
100
Book Value
₹ 90.3
Dividend Yield
0.16 %
ROCE
29.6 %
ROE
22.6 %
Face Value
₹ 1.00
Promoter holding
55.8 %
EPS last year
₹ 18.1
EPS latest quarter
₹ 3.46
Debt
₹ 95.4 Cr.
Pledged percentage
0.00 %
Net CF
₹ 571 Cr.
Price to Cash Flow
71.6
Free Cash Flow
₹ 198 Cr.
Debt to equity
0.04
OPM last year
17.2 %
OPM 5Year
17.2 %
Reserves
₹ 2,406 Cr.
Price to book value
16.0
Int Coverage
14.0
PEG Ratio
3.72

ASTRAL MONTHLY BOX BREAKOUT🔍 Chart Analysis: ASTRAL - Monthly Time Frame 📈
🚀 Monthly Range Box Breakout!
📉 After 7 months of trading in a tight range, Astral has finally broken out on the monthly time frame! 📊 This breakout suggests a potential opportunity for an upside move and profitable gains. 📈
🔥 Trade Setup:
CMP (Current Market Price): 2069 💹
SL (Stop Loss): 1890 🛑
Targets: 2355 🎯, 2652 🚀
🌈 What's a Range Box Breakout?
Imagine a coiled spring 🔄 - that's what we've been seeing in Astral's chart for the past 7 months! Now, with this breakout, the potential for an explosive move to the upside is on the horizon.
🚨 Trade Strategy:
📈 Confirm the breakout on the monthly chart.
⚖️ Set your stop-loss strategically at 1890.
🎯 Targets locked at 2355 and 2652.
💡 Why is this noteworthy?
📊 Breakouts from tight ranges often lead to substantial moves.
🚀 Monthly time frame signals a potentially significant trend change.
📉 Opportunity to ride the upward momentum for profitable gains!
📈 Disclaimer: Trading involves risk. Always do your research and utilize risk management. Not a SEBI registered analyst.
👉 Your take? Excited about this breakout potential? Share your insights below! Let's engage and learn together! 🤝💬
#ChartAnalysis #StockMarket #TechnicalAnalysis #Astral #TradingOpportunity #BreakoutAlert 📊✨

ASTRAL is good to invest for a longer termHere i have analysed ASTRAL for a longer term point of view.
The company is good to invest for a longer term prospective.
The company is maintaining healthy dividend payout.
Company's fundamentals are good.
Also take the past ten year growth trajectory.

ASTRAL 2HR chart formed Channel pattern 0r Wedge patternASTRAL 2HR chart formed Channel pattern 0r Wedge pattern
Today 12.03.2024 Narrow CPR so many have high probability in high movement in stock in either direction due to price in top channel pattern,
if price breaks the trend line movement will takes to New high in price
Target 1 ---> 18%
Target 2 ---> 50%

ASTRAL BREAKOUT Box Breakout Done .
Huge Accumulation Done.
Good for Short term and Long term.
Target 2400 , 3000 ...
Do Follow , Like ,Comment for regular updates...
Disclaimer : This is not a Buy or Sell recommendation. I am not SEBI Registered. Please consult your financial advisor before making any investments . This is for Educational purpose only.

ASTRAL LTDThis stock breakout consolidation and ATH level breakout so further up move will come
and this is just for Educational purpose only

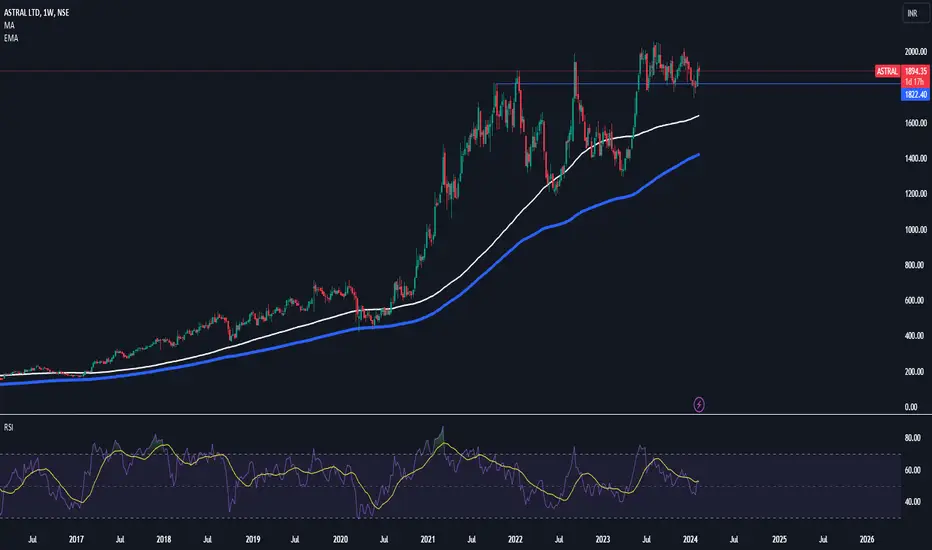
ASTRAL- FLAG & POLE ATH BreakoutASTRAL has given a flag & pole ATH Breakout in weekly time frame. Its looking good for a short term swing target of 2400.


Astral Limited Breakout - Swing Trading Buy Above - 2095
Stop-Loss Below -1860
Target - 2700
Risk to Reward - 1:2.5


Short AstralThe Market is heavy sell side but it will take a breath and follow the fall
As per price action formation has been made in 1 week TF.
Its a very big move.
Always check the sentiments of the market as per technical analysis, if the pattern get its respect.
Best of luck to all traders.
You are responsible for your Profits and loss, Shared for Educational purpose

astral given a detail analysis about this stock.please take risk according to your own appetite.i am buying this after the breakout of the trendline.

What Stand Stall today. Mine is Astral. What is yours!In today's blood bath, AStral rise. Good stock at breakout level.


SWING TRADEready for upside moment in ASTRAL LTD
hold next 3-5week
target -2020(strong resistence 2040)
stoploss-1800

Basic Idea of Supply & Demand Zone in 1 Day TFBasic Idea of Supply & Demand Zone in 1 Day TF
Just my POV regarding supply & Demand.
Don't Get confused in Supply & Demand zone.
Thank you
Sandeep Deb
8010026600

