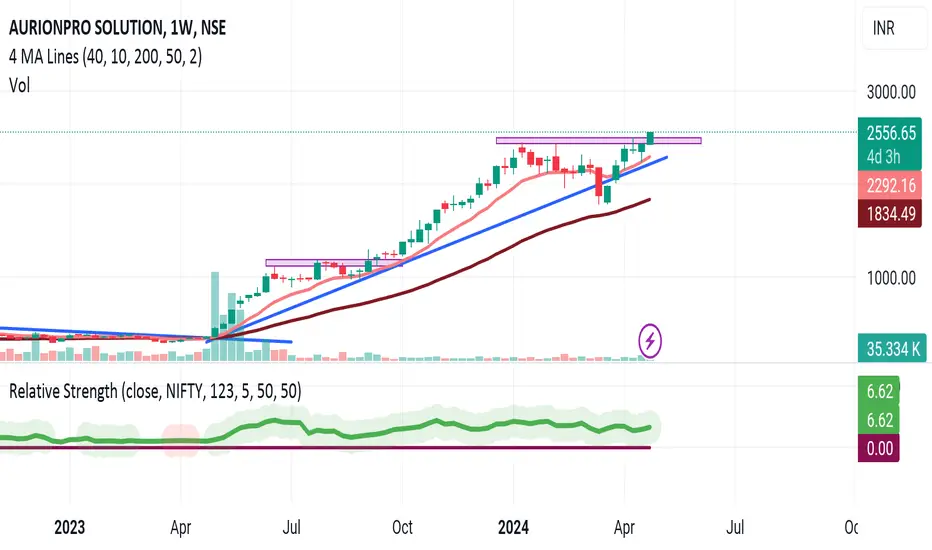
AURIONPRO SOLN LTD S/RSupport and Resistance Levels:
Support Levels: These are price points (green line/shade) where a downward trend may be halted due to a concentration of buying interest. Imagine them as a safety net where buyers step in, preventing further decline.
Resistance Levels: Conversely, resistance levels (red line/shade) are where upward trends might stall due to increased selling interest. They act like a ceiling where sellers come in to push prices down.
Breakouts:
Bullish Breakout: When the price moves above resistance, it often indicates strong buying interest and the potential for a continued uptrend. Traders may view this as a signal to buy or hold.
Bearish Breakout: When the price falls below support, it can signal strong selling interest and the potential for a continued downtrend. Traders might see this as a cue to sell or avoid buying.
MA Ribbon (EMA 20, EMA 50, EMA 100, EMA 200) :
Above EMA: If the stock price is above the EMA, it suggests a potential uptrend or bullish momentum.
Below EMA: If the stock price is below the EMA, it indicates a potential downtrend or bearish momentum.
Trendline: A trendline is a straight line drawn on a chart to represent the general direction of a data point set.
Uptrend Line: Drawn by connecting the lows in an upward trend. Indicates that the price is moving higher over time. Acts as a support level, where prices tend to bounce upward.
Downtrend Line: Drawn by connecting the highs in a downward trend. Indicates that the price is moving lower over time. It acts as a resistance level, where prices tend to drop.
Disclaimer:
I am not a SEBI registered. The information provided here is for learning purposes only and should not be interpreted as financial advice. Consider the broader market context and consult with a qualified financial advisor before making investment decisions.
AURIONPRO trade ideas

Aurionpro - Breakout AlertAurionpro Solutions Ltd.
Wedge breakout and Retest,
News: Aurionpro Wins Major Contract to Transform Corporate Banking Services in South Asia.
Higher trade quantity.
Within 52 week high zone.
Disclaimer:
For educational purpose only.
Please do your own research before taking any trades.
Happy Trading!

AURIONPRO SOLUTIONBreakout happend in this stock with rising 10 and 40 week MA's and rs indicator is also showing strength.
Keep your risk and reward ratios according to your own preferance.
This is for educational purpose, do your own research before investing.
Gives higher weekly closes on the chart.Aurionpro Solution is a stock that has been showing signs of a breakout. The stock has been in an uptrend for the past few months, and it has recently broken out above a key resistance level. This is a bullish signal, and it suggests that the stock is likely to continue to rise in the near future.
We need to keep a few scripts in radars and focus on taking position carefully with Stop loss on the chart.
Happy trading.

AURIONPRO Breakout Aurionpro Solutions Ltd., an Indian company. Aurionpro Solutions is an IT services and consulting company based in Mumbai, India. They offer a range of services such as digital innovation, enterprise security, and automation solutions. Their clients come from various industries including banking and financial services, telecommunications, and government.


swing Trade Aurion ProBuy NSE:AURIONPRO
Buy @ 240-245
Short term : 290
Mid Term : 340
Stop Loss : 200
Note: I am not a Sebi Registered Advisor. Please Consult with your Financial Advisor before Investing.

Bullish on Aurianpro (Daily)
- Trendline breakout
- Bullish engulfing bar
- Target 1 237
- Target 2 333

Looks Good above 195 for short term returns of 7-8 %Looks Good above 195 for short term returns of 7-8 %

AURIONPRO SOLUTIONSIt is on a multi year breakout in this monthly time frame. Accumulation between 175-145 could be a safe strategy with exit level of 125 for a medium term target of 350. On its way up it faces minor resistance near 240.
Do Your Own Research
This idea is not meant for short term trading, rather for medium to long term investing.


Aurionpro Solution - Cup and handleAurionpro Solution has formed cup & handle on its weekly chart
Imp points :
1. It has made a new 52 wk high with more than average recent weekly volume
2. It has now entered into the zone which has acted as demand zone multiple times earlier
3. Long wick
And the handle of weekly chart itself has formed a cup and handle on daily chart.

Cup and handle formation on weekly chart Aurionpro Solution has formed cup & handle on its weekly chart to go long
Imp points :
1. It has made a new 52 wk high with more than average recent weekly volume.
2. It has now entered into the zone which has acted as demand zone multiple times earlier.
3. Long wick formation.
The handle of weekly chart is forming another cup and handle on daily chart too and has given a breakout with higher volume too.
Entry - 90.5
Target - 111.5
SL - 79

