AUROPHARMA trade ideas

Aurobindo Pharma picking up momentum.Aurobindo Pharma Ltd. engages in the manufacturing of generic pharmaceuticals and active pharmaceutical ingredients. It operates under the following geographical segments: India, USA, Europe, and Rest of the World. Its portfolio includes antibiotics, anti-retroviral, cardiovascular, central nervous system, gastroenterological, anti-allergies, and anti-diabetics.
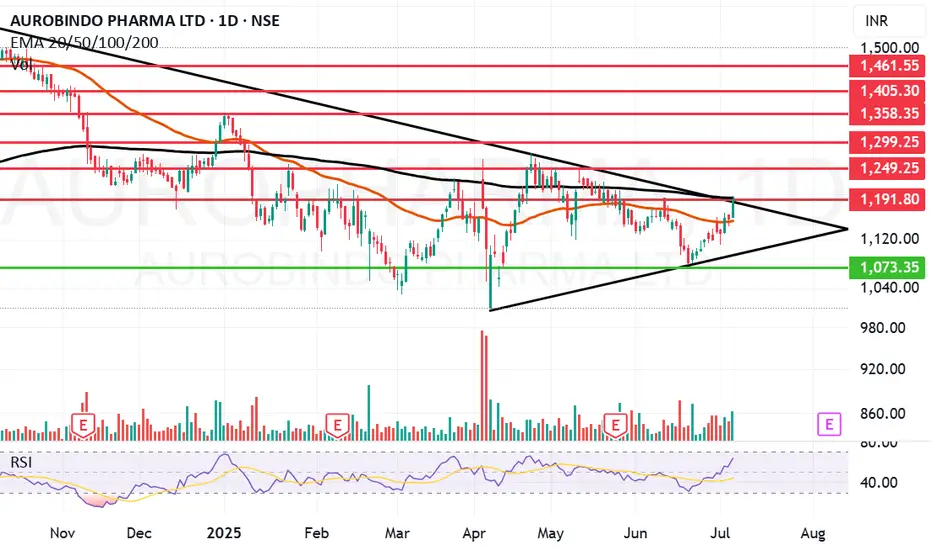
Aurobindo Pharma Ltd. Closing price is 1191.30. The positive aspects of the company are moderate Valuation (P.E. = 19.8), Strong cash generating ability from core business - Improving Cash Flow from operation, Companies with Low Debt, FII / FPI or Institutions increasing their shareholding, RSI indicating price strength and MFs increased their shareholding last quarter. The Negative aspects of the company are Stocks Underperforming their Industry Price Change in the Quarter and High promoter stock pledges.
Entry can be taken after closing above 1192 Historical Resistance in the stock will be 1249, 1299 and 1358. PEAK Historic Resistance in the stock will be 1403 and 1461. Stop loss in the stock should be maintained at Closing below 1073 or 986 depending upon your risk taking ability.
Disclaimer: The above information is provided for educational purpose, analysis and paper trading only. Please don't treat this as a buy or sell recommendation for the stock or index. The Techno-Funda analysis is based on data that is more than 3 months old. Supports and Resistances are determined by historic past peaks and Valley in the chart. Many other indicators and patterns like EMA, RSI, MACD, Volumes, Fibonacci, parallel channel etc. use historic data which is 3 months or older cyclical points. There is no guarantee they will work in future as markets are highly volatile and swings in prices are also due to macro and micro factors based on actions taken by the company as well as region and global events. Equity investment is subject to risks. I or my clients or family members might have positions in the stocks that we mention in our educational posts. We will not be responsible for any Profit or loss that may occur due to any financial decision taken based on any data provided in this message. Do consult your investment advisor before taking any financial decisions. Stop losses should be an important part of any investment in equity.
Review and plan for 27th May 2025Nifty future and banknifty future analysis and intraday plan in kannada.
This video is for information/education purpose only. you are 100% responsible for any actions you take by reading/viewing this post.
please consult your financial advisor before taking any action.
----Vinaykumar hiremath, CMT

Aurobindo Pharma Ltd view for Intraday 28th April #AUROPHARMA Aurobindo Pharma Ltd view for Intraday 28th April #AUROPHARMA
Resistance 1220 Watching above 1223 for upside movement...
Support area 1200 Below 1200 ignoring upside momentum for intraday
Watching below 1197 for downside movement...
Above 1220 ignoring downside move for intraday
Charts for Educational purposes only.
Please follow strict stop loss and risk reward if you follow the level.
Thanks,
V Trade Point

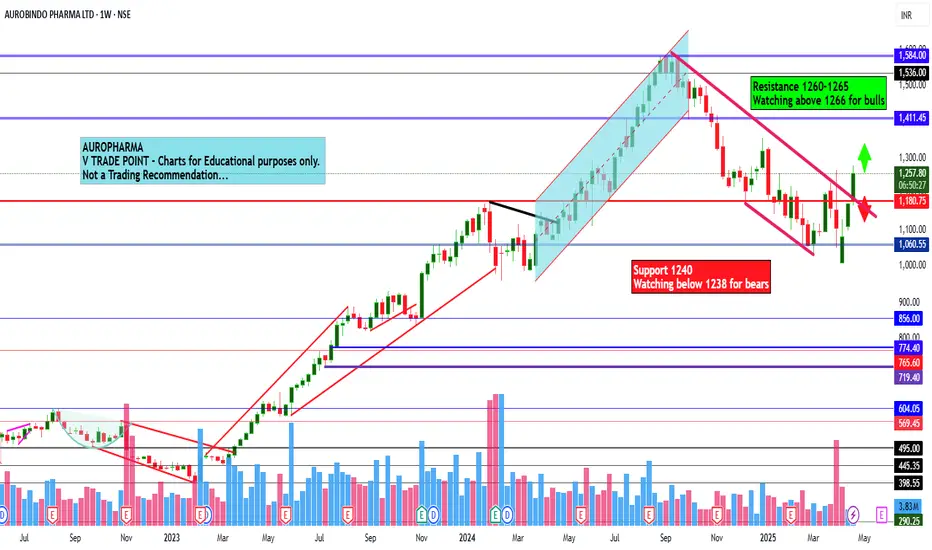
Aurobindo Pharma Ltd view for Intraday 25th April #AUROPHARMA Aurobindo Pharma Ltd view for Intraday 25th April #AUROPHARMA
Resistance 1260-1265 Watching above 1266 for upside movement...
Support area 1240 Below 1250 ignoring upside momentum for intraday
Watching below 1238 for downside movement...
Above 1250 ignoring downside move for intraday
Charts for Educational purposes only.
Please follow strict stop loss and risk reward if you follow the level.
Thanks,
V Trade Point
Auropharma arresting the fall It can be observed that Auropharma is in stage 4(markdown phase). However looking the the Price action it seems that Beers are exhuasted and Price shows lack of Downside momentum (RSI shows Bullish Divergence). We can also Observe the Undecisive Impulsive wave in the downside supporting the above statement. Hoping to see Reversal Price Pattern soon.

Amazing breakout on Weekly / Daily Timeframe - AUROPHARMACheckout an amazing breakout happened in the stock in Weekly timeframe. Wait for weekly close above the breakout level.
Breakouts happening in longer timeframe is way more powerful than the breakouts seen in Daily timeframe. You can blindly invest once the weekly candle closes above the breakout line and stay invested forever. Also these stocks breakouts are lifelong predictions, it means technically these breakouts happen giving more returns in the longer runs. Hence, even when the scrip makes a loss of 10% / 20% / 30% / 50%, the stock will regain and turn around. Once they again enter the same breakout level, they will flyyyyyyyyyyyy like a ROCKET if held in the portfolio in the longer run.
Time makes money, GREEDY & EGO will not make money.
Also, magically these breakouts tend to prove that the companies turn around and fundamentally becoming strong. Also the magic happens when more diversification is done in various sectors under various scripts with equal money invested in each N500 scripts.
The real deal is when to purchase and where to purchase the stock. That is where Breakout study comes into play.
LET'S PUMP IN SOME MONEY AND REVOLUTIONIZE THE NATION'S ECONOMY!

[Positional] AuroPharma Buy IdeaAbhishek's Idea
Note -
One of the best forms of Price Action is to not try to predict at all. Instead of that, ACT on the price. So, this chart tells at "where" to act in "what direction. Unless it triggers, like, let's say the candle doesn't break the level which says "Buy if it breaks", You should not buy at all.
=======
I use shorthands for my trades.
"Positional" - means You can carry these positions and I do not see sharp volatility ahead. (I tally upcoming events and many small kinds of stuff to my own tiny capacity.)
"Intraday" -means You must close this position at any cost by the end of the day.
"Theta" , "Bounce" , "3BB" or "Entropy" - My own systems.
=======
I won't personally follow any rules. If I "think" (It is never gut feel. It is always some reason.) the trade is wrong, I may take reverse trade. I may carry forward an intraday position. What is meant here - You shouldn't follow me because I may miss updating. You should follow the system I share.
=======
Like -
Always follow a stop loss.
In the case of Intraday trades, it is mostly the "Day's High".
In the case of Positional trades, it is mostly the previous swings.
I do not use Stop Loss most of the time. But I manage my risk with options as I do most of the trades using derivatives

AUROPHARMAPerfect bounce from OB at 1185-1205
Also support in golden fib zone (985-1580)
Entry - 1225 - 1230
SL - 1170 - 1175
T1: 1400
T2: 1550
DISCLAIMER: Not financial advice. Only for educational purposes.
Invest at your own risk

Stock Analysis Report: Aurobindo Pharma Ltd.Overview:
The chart presents a technical analysis of Aurobindo Pharma Ltd. on a daily timeframe. The stock shows a recovery pattern with a visible RSI divergence, indicating a potential bullish reversal.
Key Observations:
1.RSI Divergence:
A bullish divergence is identified as the price made lower lows while the RSI formed higher lows, signaling waning bearish momentum and the likelihood of an upward move.
2.Critical Support Levels:
Immediate support is marked at ₹1,273.35, corresponding to the 200-day moving average.
A strong base exists at ₹1,199.40 and ₹1,101.55, which acted as previous demand zones.
3.Potential Resistance Zones:
Initial resistance levels are observed at ₹1,310.80 and ₹1,346.60.
Major resistance is seen at ₹1,403.25 and ₹1,450.35, where the stock could face selling pressure.
4.Buying Strategy:
Enter long positions only if the price stabilizes above ₹1,273.35, confirming support.
Watch for a breakout above ₹1,310.80 for momentum trades targeting higher resistance levels.
5.Volume Analysis:
Increased volume on recent upward moves supports the bullish sentiment.
Monitor volume patterns for confirmation of breakouts or trend reversals.
Conclusion:
Aurobindo Pharma shows signs of a potential bullish reversal. Traders should closely observe the ₹1,273.35 support level and enter only upon confirmation. Targets are placed at ₹1,310.80, ₹1,346.60, and beyond. Implement proper risk management to account for potential volatility.

AUROPHARMADisclaimer:
This is not financial advice. Please do your own research or consult with a financial advisor before making any investment decisions. Investments in stocks can be risky and may result in loss of capital.

Aurobindo Pharma Long TradeHello,
Trend-Based Analysis. Buy the Dips, Sell The Rallies, Also Following the Trend. Let's see where the Price Action takes us, Riding the wave. Potential trade setups based on trend momentum.
Technical analysis based on trend identification and momentum, Looking for high-probability setups within the prevailing trend.
Analyzing the current market trend and potential future price movement. Focusing on risk management and reward-to-risk ratios.
Details is Mentioned in Chart, Read carefully.. .

Aurobindo Pharma reversal likelyThe stock has corrected significantly. It is now at weekly long term support . hammer formation seen on daily TF . In addition there is RSI bullish divergence. short term up move is highly likely

AUROPHARMA NSE:AUROPHARMA
Good Sock of Mid Cap Sector
Taken Support 1215
Long Term Target is 1550++
SL- 1181
Closed on 10 Day MA

auropharma short term CE oppngo long
sl of 1219
on daily it has come to 2.0 of FIB o its downside.
go easy, not an aggressive opportunity.

Aurobindo Pharma Ltd view for Intraday 13th Nov #AUROPHARMA Aurobindo Pharma Ltd view for Intraday 13th Nov #AUROPHARMA
Resistance 1280 Watching above 1282 for upside movement...
Support area 1250. Below 1265 ignoring upside momentum for intraday
Support 1250.Watching below 1248 for downside movement...
Resistance area 1280
Above 1265 ignoring downside move for intraday
Charts for Educational purposes only.
Please follow strict stop loss and risk reward if you follow the level.
Thanks,
V Trade Point

AUROPHARMA NSE BULLISH FLAG /RBC&H 7M AUROPHARMA WTF Analysis
TRADE PLAN
ENTRY -1510 -1550 On BO of Bullish Fage DTF Close
SL -1405 or Weekly Low Close Price
TARGET --01-1719 , TGT02--1931
Hold For a Year or TGT 2
Chart Pattern :
STOCK has recently touched its LTH of 1592. Previously Impulse after forming a 2Y-7M RBC on the DTF/WTF. The recent 7Month Swing has now ripened to a Bullish Flag Pattern on a Pullback ready to BO above 1510. The Swing Target to the Recent ATH will give 12%+ return,
INDICATORS EMA :
The Price is Currently Trading below 20EMA, and 20EM above 50EMA in DTF. STOCK EMAs are currently aligned in a ascending order 200 to 20 indicating a bullish Trend on DTF/WTF.
FIBO E :
After the Bounce-back from 23.6% FIBO Retracement Level, Price is currently trading near the 11490 on DTF Impulse uptrend
Volumes: There CURRENTLY not Encouraging Though on the Weekly timeframe
Keep in your Priority Watch List
Disclaimer: For Education/Reference Purpose Only, Trade at your Own Risk with correct position sizing and SL based on your Risk apetite (Exit when price closes 7to8% below your Entry).
Trail Your SL progressively. Learn/Know and Review the Stock trading Technical Terminology. Check Verify the Financial fundamentals of the Stock and Seek Advice from a Certified Financial Advisor prior to Investing. Prefer Entry with 25% quantity, Add in Tranches of 25%-50% as prices moves upwards recommended.
MTFA- Multiple Time Frame Analysis
DTF -Daily Time Frame
WTF-Weekly Time Frame
MTF- Monthly Time Frame
ATH-All Time High
LTH/ATH -LifeTime High
RBC&H-Rounding Bottom Cup/Handle
BO- Breakout Close
EMA -Exponential Moving Average
FIBO R/E -Trend based Fibonacci Retracement/Extension
SL Stop Loss
TBD- To be Decided
CHoCH- Change of Character Bullish/Bearish
MSB/BOS -Break Out Structure
FVG Fair Value Gap
20VMA -20Volume Moving Average
SWING/POSITIONAL Trade

AUROPHARAM Swing Long SetupEnter only when 15minute candle closes above the Entry Zone Price - 1461.70
Target with Risk to reward 1:2 is 1571.1
Stoploss only when 1 day candle closes below the price - 1407
Note: This is not any financial advice, this is for education purpose only.

Auro Pharma Ltd view for Intraday 18th September #AUROPHARMA Auro Pharma Ltd view for Intraday 18th September #AUROPHARMA
Buying may witness above 1575
Support area 1560. Below ignoring buying momentum for intraday
Selling may witness below 1549
Resistance area 1560-1565
Above ignoring selling momentum for intraday
Charts for Educational purposes only.
Please follow strict stop loss and risk reward if you follow the level.
Thanks,
V Trade Point

Auro Pharma Ltd view for Intraday 17th September #AUROPHARMA Auro Pharma Ltd view for Intraday 17th September #AUROPHARMA
Buying may witness above 1575
Support area 1549-1550. Below ignoring buying momentum for intraday
Selling may witness below 1549
Resistance area 1575
Above ignoring selling momentum for intraday
Charts for Educational purposes only.
Please follow strict stop loss and risk reward if you follow the level.
Thanks,
V Trade Point

AUROPHARMA Ready for a Breakout!📈 Bullish momentum building with strong trendline support
🔥 Watch for breakout above ₹1,585.20
🎯 Next targets: ₹1,625 🚀

Auro Pharma Ltd view for Intraday 12th September #AUROPHARMA Auro Pharma Ltd view for Intraday 12th September #AUROPHARMA
Buying may witness above 1520
Support area 1499-1500. Below ignoring buying momentum for intraday
Selling may witness below 1499
Resistance area 1520
Above ignoring selling momentum for intraday
Charts for Educational purposes only.
Please follow strict stop loss and risk reward if you follow the level.
Thanks,
V Trade Point

Auro Pharma Ltd view for Intraday 5th September #AUROPHARMA Auro Pharma Ltd view for Intraday 5th September #AUROPHARMA
Buying may witness above 1565
Support area 1540. Below ignoring buying momentum for intraday
Selling may witness below 1540
Resistance area 1565
Above ignoring selling momentum for intraday
Charts for Educational purposes only.
Please follow strict stop loss and risk reward if you follow the level.
Thanks,
V Trade Point
