AWL 1W📊 Financial Performance Highlights
Q2 FY25 (H1 2024–25)
Revenue: ₹14,460 cr (+18% YoY)
Net profit: ₹311 cr vs. prior-year loss of ₹131 cr
H1 Operating EBITDA: ₹1,232 cr (+349% YoY); PAT ₹624 cr
Concall Analysis - read conference calls
+5
Angel One
+5
ICICI Direct
+5
Q3 FY25 (Quarter ended Dec 2024)
Revenue: ₹16,859 cr (+31% YoY)
PAT: ₹411 cr (+105% YoY); EBITDA ₹792 cr (+57% YoY)
Moneycontrol
+2
Business Today
+2
Concall Analysis - read conference calls
+2
Key growth drivers:
Edible oils: Volume +4–6% YoY; Rev. +38–39%
Foods & FMCG: Volume +22–23%, Rev. +22–34%
E‑commerce/QC channels surged ~41%
Reddit
+12
Business Today
+12
ICICI Direct
+12
Business Today
+3
Moneycontrol
+3
ICICI Direct
+3
Q4 FY25 (Quarter ended Mar 2025)
Volume growth: +7% YoY across businesses
FY revenue: ~₹62,000 cr (+26% YoY)
Foods & FMCG segment reached ~₹6,150–6,273 cr for FY + strong rural expansion
Rebranding to AWL Agri Business effective March 17, 2025
Business Today
+2
Business Standard
+2
HospiBuz
+2
HospiBuz
🌍 Strategic & Operational Drivers
Rural expansion: From ~5K towns in 2022 to >43K by Dec 2024; aimed >50K by FY25
Business Standard
+4
Angel One
+4
Business Today
+4
Diversification: Rising share from foods & FMCG (~11–44% of revenues depending on metrics), personal care, and industrial products
Wikipedia
+7
Reddit
+7
Business Today
+7
E-commerce push: QC platforms (Blinkit, Zepto) and HORECA segment scaling up
Angel One
+2
Reuters
+2
Business Standard
+2
Commodity tailwinds: Benefits from edible oil price cycles have improved margins
ICICI Direct
+11
Concall Analysis - read conference calls
+11
Business Standard
+11
Corporate cleanup: Exit from Adani Group post-US legal noise; simplifies ownership & governance
Business Today
+3
Financial Times
+3
Reuters
+3
⚖️ Strengths vs. Risks
Strengths Risks / Challenges
Market leader in edible oils Commodity price volatility
Rapid rural & e‑com expansion Competitive, low-margin category
Diversified revenue base Reputational overhang from Adani exit
Strong financial rebound post-loss Execution risks in new ventures
Global JV benefits ESG concerns—deforestation & labor
Moneycontrol
Angel One
+2
Reuters
+2
Concall Analysis - read conference calls
+2
Financial Times
Adani Wilmar
Wikipedia
🧭 Outlook & Analyst Sentiment
Management is guiding for ~10% volume growth next year, with edible oils +6% and >20% food/FMCG growth
Reuters
+1
Business Standard
+1
Nuvama projects ~64% upside based on execution; emphasizes long‑term potential in foods/FMCG category
Business Today
Analysts view the exit from Adani as a de-risking, enabling sharper focus and better valuation transparency
✅ Summary
AWL Agri Business (ex-Adani Wilmar) stands as a formidable FMCG player with robust top-line growth (20–30% YoY), strong profitability, and ambitious rural and e-commerce expansion. While commodity swings and reputational risks remain, the company has successfully pivoted toward branded foods, diversified its portfolio, and streamlined corporate structure.
Disclaimer: The information provided is for educational and informational purposes only and should not be considered as financial advice. Investing in the stock market involves risk, and past performance is not indicative of future results. Please consult with a certified financial advisor or conduct your own research before making any investment decisions. We are not responsible for any losses incurred as a result of using this information. Stock market investments are subject to market risks; read all related documents carefully.
AWL trade ideas
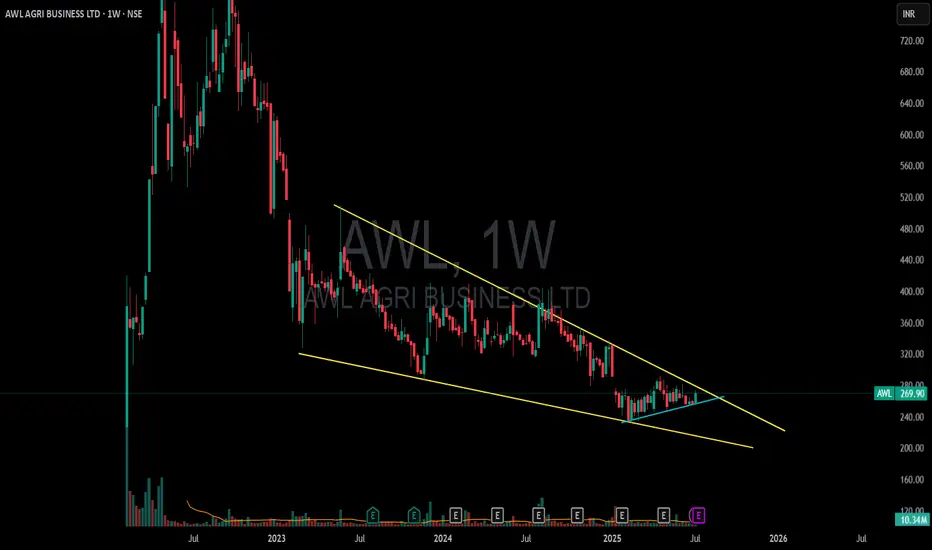
AWL agri Business good to be in portfolioAWL agro Business ( 259 ) is a good to have stock in portfolio. Is trading at 27.8 PE of Fy26 9.43.
We feel it has potential to move to 600+. Will be looking for accumulation in 231 to 253 zone.
Can it be a 100% idea from current levels?Down by ~70% from it's ATH. Revenue and Net Profit improving with possibility of improving margins (with new acquisitions and premiumization).
Strong brand value.
Adani group out from promoters list which constantly generated bad PR in recent past.
There inventory cycle is of less than 2 months. And they are holding highest amount of inventory. Meaning all of it will sell in the quarter. We can create a correlation with expected sales.
CWIP also 25% of current assets - production capacity increasing.
The whole FMCG sector is ready for boost as it's been trading within a range from past few years.
Current prices are also lower than it's intrinsic value.
Technically seems like a cup with handle pattern in formation.

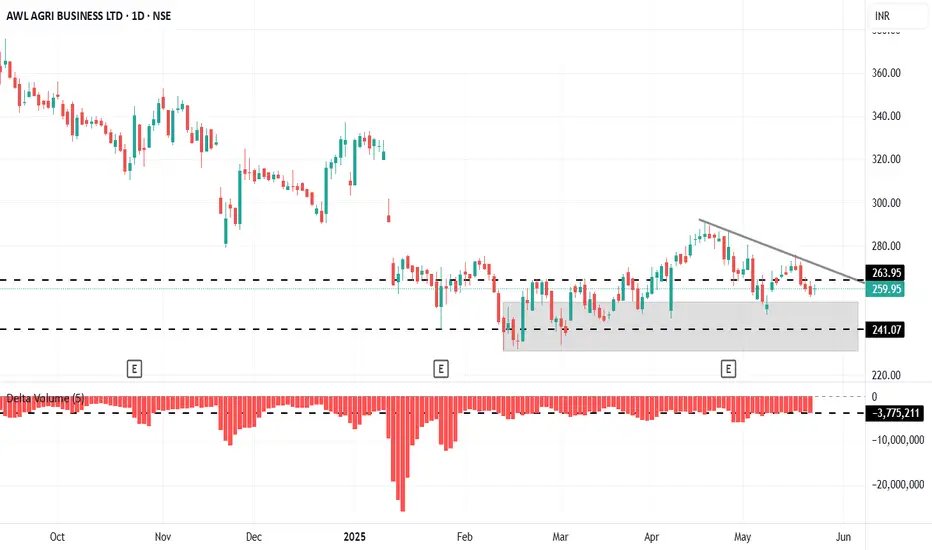
ADANI WILMAR : In A Buy Zone but facing a major resistanceADANI WILMAR : In A Buy Zone but facing a major resistance at 275.
MACD looks good
Still under 200 SMA
( Not a Buy / Sell Recommendation
Do your own due diligence ,Market is subject to risks, This is my own view and for learning only .)

AWLNSE:AWL
Note :
1. One should go long with a Stop Loss, below the Trendline or the Previous Swing Low.
2. Risk :Reward ratio should be minimum 1:2.
3. Plan your trade as per the Money Mangement and Risk Appetite.
Disclamier : You are responsible for your profits and loss.
The idea shared here is purely for Educational purpose.
Follow back, for more ideas and their notifications on your email.
Support and Like incase the idea works for you.

Fallen 67% from the Peak - "Buy when everyone Sells"Any good fundamental stock, if falls 50% from the peak is good opportunity to apply the principal, "Buy when everyone Sells".
if it reaches its previous high then the return generated will be 205%.

Go long in Adani Wilmar - AWLThere is a trendline breakout in Adani Wilmar. Investor who can seeking a good oppotunity to invest in Adani group, they can invest. Today market closing above 24380 is a good sign for reversal. From here in AWL, targets can be 344, 360, 380,395,423

Adani Wilmar RBTS 25% gainBuy Adani wilmar according to RBTS strategy.
LOWER LIMIT and buy price - 320
UPPER LIMIT and sell price - 401
Gain 25%.
Please do your own analysis before investing.
Hope you learned something new from my ideas.
Do like, share and follow me. Thank you!

AWL_06.10.2024Adani Wilmar Ltd. perfect buy @ cmp 336. Chart pattern clearly suggest targets below.
T1 : 404
T2 : 483
For educational purposes only.

Adani Wilmar Ltd near crucial levels
➡️ Bullish breakout above ₹357.35
📈 Next targets: ₹380.20, ₹401.85
⬇️ Bearish breakout below ₹341.65
📉 Support levels: ₹322.35, ₹315.55


Technical Analysis of Adani Wilmar Ltd (AWL)Technical Analysis of Adani Wilmar Ltd (AWL)
Based on the H1 chart, here's a technical analysis of Adani Wilmar Ltd (AWL):
Trend Analysis
Short-term: The stock seems to be in a consolidation phase after a slight uptrend.
Long-term: The 200-day EMA (Exponential Moving Average) is above the current price, indicating a long-term downtrend.
Support and Resistance Levels
Support : The 0.382 Fibonacci retracement level at 370.65 and the 0 level at 351.15 are potential support levels.
Resistance: The 0.618 Fibonacci retracement level at 382.70 is the immediate resistance.
Technical Indicators
RSI (Relative Strength Index): The RSI is currently below 50, suggesting that the stock is oversold. This could be a potential buying opportunity.
Trading Strategy - Based on the analysis, a potential trading strategy could be:
Buy Zone: If the price breaks above the 0.382 Fibonacci level (370.65) and the 0 level (351.15), it could be a bullish signal. Consider buying at or near the current price (CMP@371.70).
Stop Loss: Place a stop loss below the 0 level (351.15) to limit potential losses.
Target: The target could be the 0.618 Fibonacci level (382.70).
Risk Management: Always practice proper risk management by allocating a portion of your capital to each trade and diversifying your portfolio.
Note: This analysis is based on the information provided in the chart. It's essential to conduct further research and consider other factors before making any investment decisions.
Disclaimer:- This analysis is based on the provided chart and is for informational purposes only. It does not constitute financial advice. Always consult with a financial advisor before making investment decisions. Do your own research before buying this stock because I am not SEBI registered person and this is just for educational purposes. We are not responsible for your loss.
Thanks for your support as always

Technical Analysis of Adani Wilmar Ltd (AWL)Technical Analysis of Adani Wilmar Ltd (AWL)
The technical analysis of Adani Wilmar Ltd (AWL) on the TradingView platform. The chart appears to be for the 1-hour timeframe (1h).
Key Observations:
Support and Resistance Levels:
The chart highlights several support and resistance levels.
The 0.618 Fibonacci retracement level at 382.75 is identified as a potential resistance level.
The 0.5 Fibonacci retracement level at 376.70 is also marked as a potential resistance level.
The area between 351 and 367 is suggested as a "Buy Zone."
If the price breaks below the 351 to 367 support zone, it might retest the 342 to 332 range.
Buy Recommendations:
The analyst suggests starting to buy AWL at the current market price (CMP) of 371.70.
They also recommend buying more if the price rises above 351.
Overall Analysis: - Based on the technical analysis presented in the chart, it seems to be bullish on AWL. They believe that the stock is likely to rise, and they recommend buying at the current price levels or even higher if the price breaks above 351. However, it's important to note that technical analysis is not foolproof, and market conditions can change rapidly. Investors should conduct their own research and consider other factors before making investment decisions.
Additional Considerations:
Fundamental Analysis: While technical analysis provides insights based on price charts, it's also essential to consider fundamental factors such as company performance, industry trends, and economic conditions.
Risk Management: Investing in stocks involves risks, and it's crucial to implement risk management strategies such as diversification and setting stop-loss orders.
Personal Risk Tolerance: Investors should assess their own risk tolerance and invest accordingly.
Disclaimer: - This analysis is based on the technical analysis of the stock and is for informational purposes only. It does not constitute financial advice. Investors should consult with a financial advisor before making any investment decisions. Do your own research before investing in stocks. I am not SEBI registered person and you are responsible for your loss.
Thanks for your support as always

Technical Analysis of Adani Wilmar Ltd(AWL)Technical Analysis of Adani Wilmar Ltd(AWL) - The technical analysis of Adani Wilmar (AWL) stock. It is created using the TradingView platform by the user "ForexTrader4all".
Here's a breakdown of the information presented in the chart:
Stock Information:
Symbol: AWL
Timeframe: 1 hour
Exchange: NSE (National Stock Exchange of India)
Current Price: 375.80 INR (Indian Rupee)
Change: -1.20 INR (-0.32%)
Technical Indicators:
EMA (200, high): 963.32
RSI (14, high): 46.18
Price Levels Suggestions:
Start Buying Above: 380 INR
Buy More Above: 351 INR and 330 INR
Support and Resistance Levels:
Support: 330.40 INR
Resistance: 449.65 INR
Chart Elements:
Candlesticks: Represent the price action of the stock over the specified timeframe.
Moving Average (EMA): A trend-following indicator that smooths out price fluctuations.
Relative Strength Index (RSI): A momentum oscillator that measures the speed and change of price movements.
Horizontal Lines: Indicate potential support and resistance levels.
Diagonal Lines: Represent trend lines or channels.
Overall Analysis: - Based on the technical indications in the chart, here are some potential scenarios:
Price Action: The stock is currently trading below its 200-day EMA, suggesting a bearish trend. However, the RSI is near the 50 level, indicating that the selling momentum may be weakening.
Support and Resistance: The horizontal lines at 330.40 INR and 449.65 INR represent potential support and resistance levels. If the price breaks below the support level, it could signal further downside.
Buy Signals: The chart suggests potential buying opportunities above 380 INR, 351 INR, and 330 INR. However, it's important to consider other factors before making any investment decisions.
Disclaimer: This analysis is based solely on the information provided in the chart and should not be considered financial advice. It's essential to conduct thorough research and consider multiple factors before making any investment decisions and do your own research because I am not SEBI registered person to suggest any stock. This is my personal opinion based on my technical understanding/analysis and only for education purposes.
Thanks for your support

Double bottom & Tweezers bottom On Adani Wilmar, Monthly chartAdani Wilmar showing bottom out indication on Monthly chart .It's form tweezers bottom which indicate trend reversal & also form a double bottom .Target will be around 490

ADANI WILMAR Showing Breakage in Volume & Structure,NSE:AWL
.......................................................................
Not a Adani Lover.... But Some Bussinesses are Considered as White Collar.... Specially when you are aware of the original Product of the company.
.............................................................................................................................................
.............................................................................................................................................
Strong recovery in Profitability, after subdued profits in H1 of last year.
➢ Trailing 9-Month EBITDA at INR 1,471 Crore.
➢ Profitability was volatile in FY24 due to hedge dis-alignment. However, profitability is improving over the longer-term.
.............................................................................................................................................
.............................................................................................................................................
▪ Q1 volume growth of 12% YoY
▪ Steady growth in staple packaged foods. Edible oils grew by 12% YoY and Foods & FMCG grew by 42% YoY
▪ In Industry essential segment, both Oleo and Castor business grew in double digits, though overall volume impacted due to oil meal business
▪ Q1 revenue at INR 14,169 crores
▪ Revenue grew by 10% YoY in-line with volume growth as lapping of disinflationary impact of edible oil prices on revenue is complete
▪ Highest-ever EBITDA in Q1‘25 at INR 619 crores
▪ Edible oil business profitability has improved on back of stable edible oil prices
▪ Demand Environment (branded oil and foods)
▪ Demand environment stays steady in packaged staple foods on back of ongoing shift towards branded products
▪ Company stays focused on gaining market share, particularly in under-indexed markets & categories
▪ Incorporating local nuances to enhance regional engagement through customized campaigns, specialized packaging, localized pricing strategies, targeted schemes
▪ ESG Update
▪ Adani Wilmar has been included in FTSE4Good Index Series
▪ Company is committed to improve its processes for ESG performance, enhance disclosures and participate in key ESG ratings
.............................................................................................................................................
.............................................................................................................................................
Key Takeaways: Q1’25
▪ Overall volumes grew by 12% YoY in Q1’25
▪ Edible Oil volumes surpasses 1 Million MT in Q1’25
▪ Food & FMCG crossed quarterly revenue of ~INR 1,500 Crores in Q1’25
▪ Edible Oil:
▪ Edible Oil volumes grew by 12% YoY in Q1’25
▪ Both Sunflower oil and Mustard oil grew double digit during the quarter.
▪ Food & FMCG:
❑ Food & FMCG volumes grew by 42% YoY (Ex-G2G business, Food volumes grew by 19% YoY)
❑ The revenue from branded products in the domestic market has been growing consistently YoY at over 30% for the past eleven quarters.
▪ Distribution:
❑ Company’s direct reach grew by 18% YoY to reach 7.4 Lac Outlets at the end of Q1’25
❑ Rural towns coverage grew by 40% YoY to 30,000+ towns at the of June 2024
▪ Channel Growth:
❑ Alternate channel grew by 19% YoY in Q1’25 (in volume terms)
❑ Branded exports grew by 36% YoY in Q1’25 (in volume terms)
❑ HoReCa business grew by 91% YoY (in volume terms), with quarterly revenues crossing ~INR 150 Crore in Q1’25
▪ ESG:
❑ Inclusion of AWL in FTSE4Good Index Series


AWL SWING TRADE IDEAAWL took off recent gap up with gud Q1 results price action looking promising too. can play this as support base swing trade with ur prefered RR.

Falling Wedge pattern breakout in AWLADANI WILMAR LTD
Key highlights: 💡⚡
✅On 1 Day Time Frame Stock Showing Breakout of Falling Wedge Pattern.
✅Strong Bullish Candlestick Form on this timeframe.
✅It can give movement up to the Breakout target of 444+.
✅Can Go Long in this Stock by placing a stop loss below 344-.

AWLNSE:AWL
Trading at support level
Sl- 315
Target- 354/ 368/388
Pivot support placed at 304 for long term player
RSI>40

AWL for buy, 1:4 risk reward Based on the chart analysis, the asset has completed its five-wave structure, indicating a potential for upward movement. After the five waves, we can anticipate an ABC correction pattern forming. To capitalize on this, aim for the first target (TR) at 440 and the second target (TR) at 517, setting a stop loss (SL) at 285.
However, if AWL initiates another five-wave upward movement, the target could be significantly higher. Keep an eye on the market for further developments and adjust your strategy accordingly.


AWL - Adani Wilmar Ltd - An Opportunity to Buy & HoldAdani Wilmar (AWL) technical analysis shows mixed signals:
Bullish Signs:
Upward trend: AWL has been trending upwards for the past few months and is currently near a six-month high.
Recent bullish reversal: Technical indicators like the Awesome Oscillator are trending upwards, suggesting a continuation of the uptrend.
Strong upward move: The stock has seen a strong price increase recently.
Bearish Signs:
Overbought indicators: Some indicators like Williams %R and Stochastic are falling from overbought levels, which could signal a potential pullback.
Volume: While the price is rising, keep an eye on volume. Lower volume during a price rise can indicate a weaker uptrend.
Overall, the technical analysis for AWL is inconclusive.
Remember, technical analysis should only be one part of your investment strategy. Consider other factors like fundamentals, market conditions, and your own risk tolerance before making any investment decisions.
My Opinion:- Overall technical analysis suggests that the trend is bullish.
Thanks for your support as always
Disclaimer: This information is for educational purposes only and shouldn't be considered financial advice. It's important to do your own research before making any investment decisions.
