Review and plan for 18th July 2025Nifty future and banknifty future analysis and intraday plan.
Analysis of quarterly results.
This video is for information/education purpose only. you are 100% responsible for any actions you take by reading/viewing this post.
please consult your financial advisor before taking any action.
----Vinaykumar hiremath, CMT
AXISBANK trade ideas

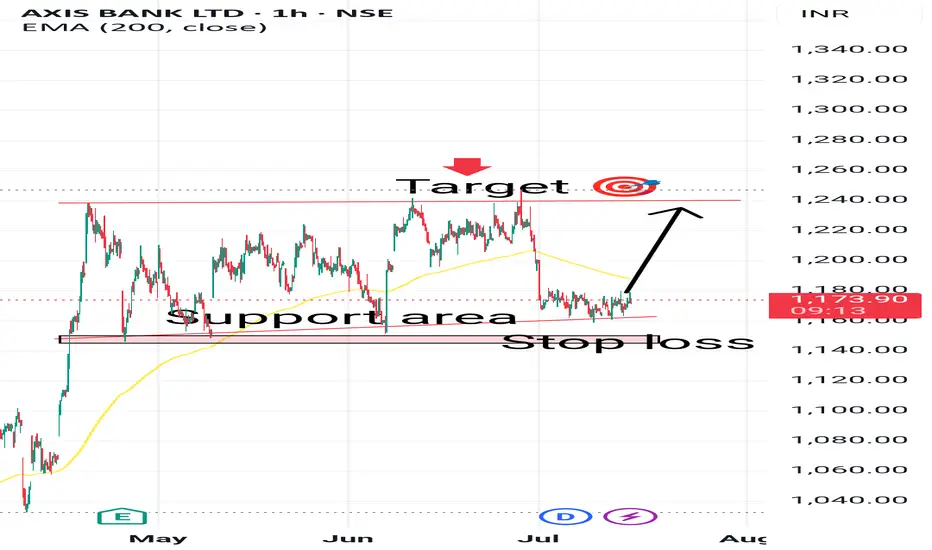
Axis Bank BuyAxis Bank trading in range. Currently it is near the bottom of the range. Buy @CMP (1165) with SL of 1140 (6 points below previous low of the range. Price may make new low before going up) and target of 1200 & 1235.

Axis Bank Hi,
price Trade in zone . And currently it is available at support area.
So it's possible that price will move above The support area
This idea is for Educational purpose and paper trading only. Please consult your financial advisor before investing or making any position. Facts or Data given above may be slightly incorrect. We are not SEBI registered
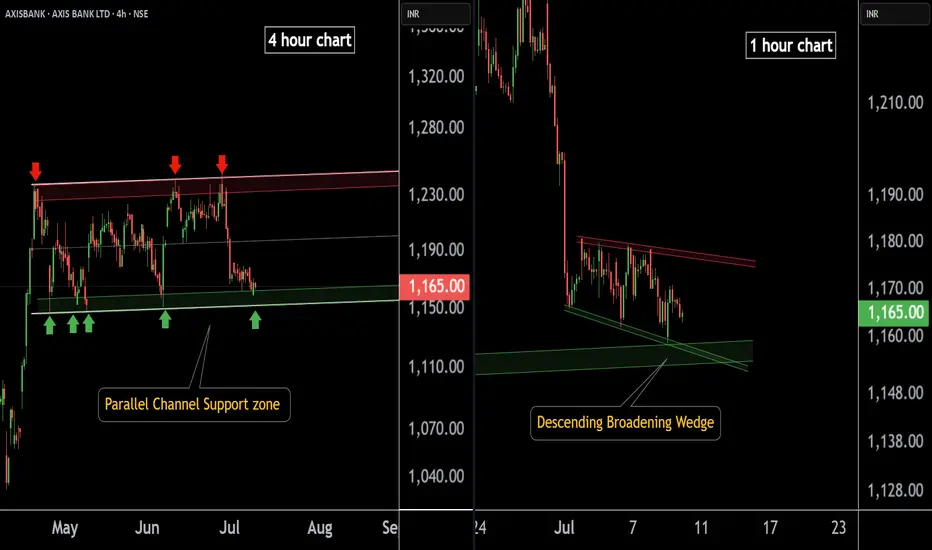
AXIS BANK at Best Support !!Here are two charts of Axis Bank — one in the 4-hour timeframe and the other in the 1-hour timeframe.
4-Hour Timeframe Chart:
In this chart, Axis Bank is moving within a parallel channel, with the support zone lying in the 1150–1160 range.
1-Hour Timeframe Chart:
Axis Bank is forming a descending broadening wedge pattern, with support near the 1150–1155 zone.
If this level is sustain ,then we may see higher prices in Axis Bank.
Thank You !!
AXIS BANK at Best Support !!This is the 1 hour chart of AXIS BANK .
Axis bank having a good law of polarity at 1200 level.
Axisbank is moving in well defined parallel channel with support range 1160-1180 .
If this level is sustain , then we may see higher prices in AXISBANK.

AXIS BANK - BUY - 1350 - 1418AXIS Bank is expected to go long with buy level on 1177 and 1130.
the price expected to hit the levels of 1350 (20%) and 1418 (25%).
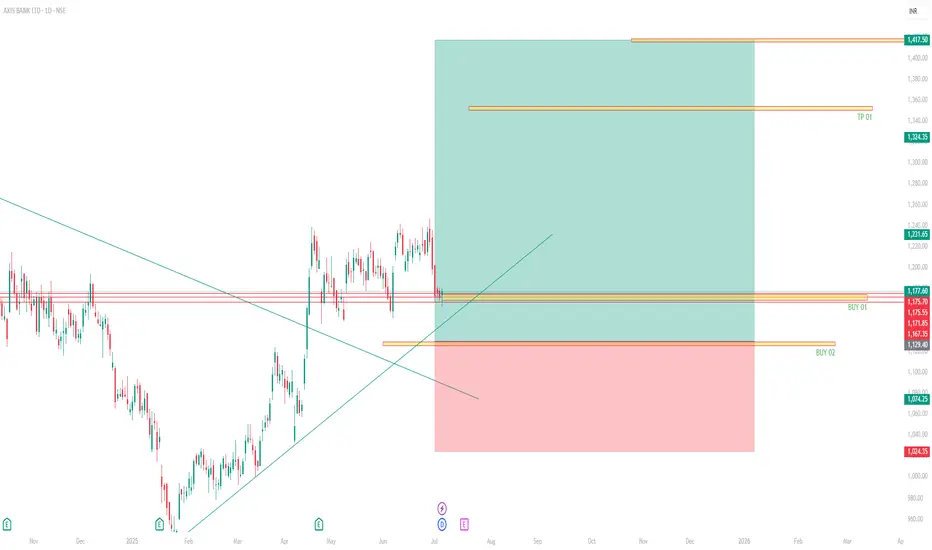
Axis ...moving in a channel..Good for swing traders for short term. Stock moving in a channel... price levels given


AXIS BANK will touch 1273 than 1349 Soon.Axis bank is in Bull run with cup and handle pattern going to be finish and going to be touch last High soon.

AXIS BANK - FOR SWING TRADEOn a weekly time frame price has given a curve line breakout and currently price is in a range .
Previous week a Pin bar candle has formed in it's Fib 50% level which is also a good support area.
Current price is 1219
This week price can give us a good upside move, if not then price will be in the same range.

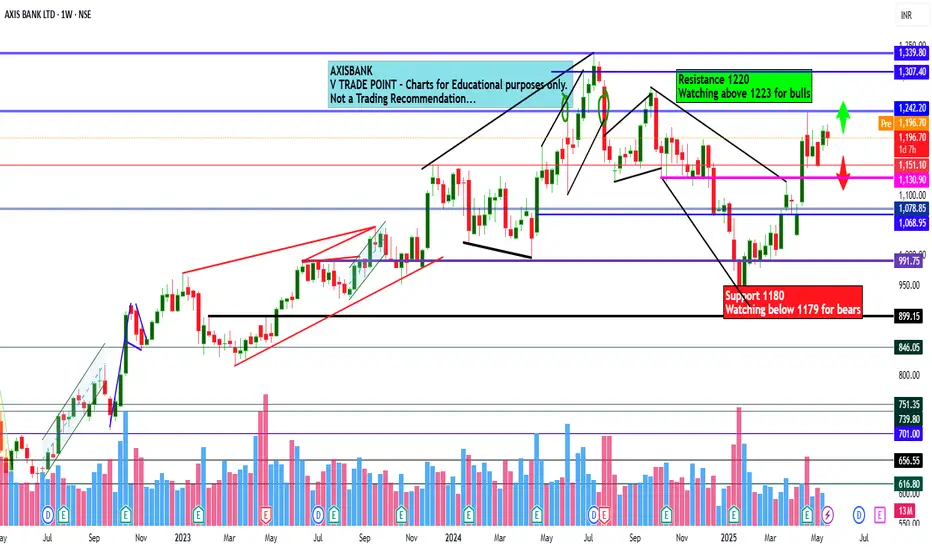
Axis Bank Ltd view for Intraday 22nd May #AXISBANK Axis Bank Ltd view for Intraday 22nd May #AXISBANK
Resistance 1220 Watching above 1223 for upside momentum.
Support area 1180 Below 1180 ignoring upside momentum for intraday
Watching below 1179 for downside movement...
Above 1200 ignoring downside move for intraday
Charts for Educational purposes only.
Please follow strict stop loss and risk reward if you follow the level.
Thanks,
V Trade Point
Axis Bank Ltd view for Intraday 20th May #AXISBANK Axis Bank Ltd view for Intraday 20th May #AXISBANK
Resistance 1220 Watching above 1223 for upside momentum.
Support area 1180 Below 1200 ignoring upside momentum for intraday
Watching below 1179 for downside movement...
Above 1200 ignoring downside move for intraday
Charts for Educational purposes only.
Please follow strict stop loss and risk reward if you follow the level.
Thanks,
V Trade Point

AxisBank could drop to 1150 and 1100 for bounce backAxis Bank could drop to 1150 and 1100 levels for bounce back to 1200 and plus levels.
Note: This is not a buy/sell trade call. Trade at your own will and analysis. Use stop loss too.

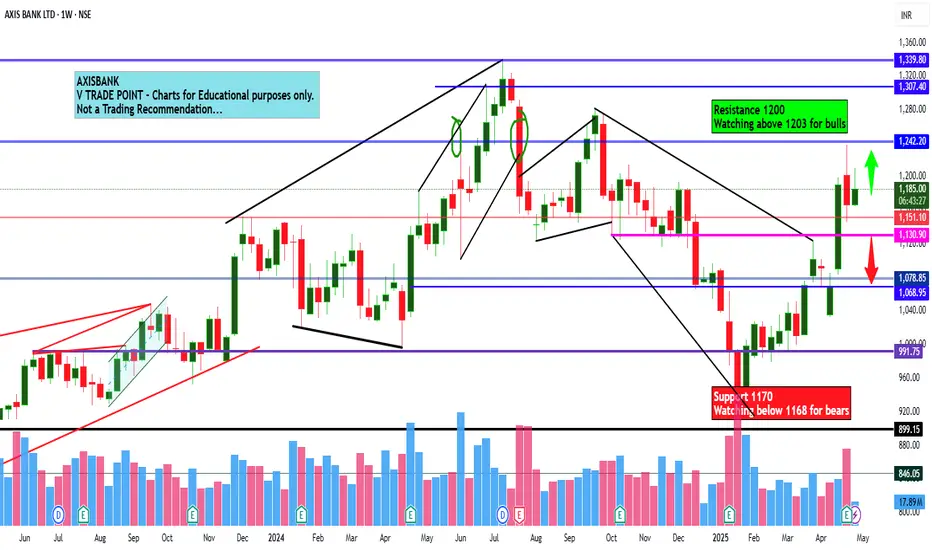
Axis Bank Ltd view for Intraday 5th May #AXISBANK Axis Bank Ltd view for Intraday 5th May #AXISBANK
Resistance 1200-1202 Watching above 1203 for upside movement...
Support area 1170 Below 1180 ignoring upside momentum for intraday
Watching below 1168 for downside movement...
Above 1180 ignoring downside move for intraday
Charts for Educational purposes only.
Please follow strict stop loss and risk reward if you follow the level.
Thanks,
V Trade Point

Axis Bank Ltd view for Intraday 2nd May #AXISBANK Axis Bank Ltd view for Intraday 2nd May #AXISBANK
Resistance 1200 Watching above 1203 for upside movement...
Support area 1170 Below 1190 ignoring upside momentum for intraday
Watching below 1168 for downside movement...
Above 1190 ignoring downside move for intraday
Charts for Educational purposes only.
Please follow strict stop loss and risk reward if you follow the level.
Thanks,
V Trade Point
Live buy signal in AxisBank at 1182.6Live Khareedo (Buy) signal in AxisBank at 1182.6. Lets see how much it will rise.
Note: This is not a buy/sell trade call. Use stop loss.

Axis Bank Ltd view for Intraday 28th April #AXISBANK Axis Bank Ltd view for Intraday 28th April #AXISBANK
Resistance 1175 Watching above 1177 for upside movement...
Support area 1160 Below 1160 ignoring upside momentum for intraday
Watching below 1157 for downside movement...
Above 1170 ignoring downside move for intraday
Charts for Educational purposes only.
Please follow strict stop loss and risk reward if you follow the level.
Thanks,
V Trade Point

63 points dropped #AxisBank after #SignalsWalaJin signal63 points dropped #Axisbank share after generation of Signal "Becho" means sell by my custom designed indicator named SignalsWalaJin
Note: This is not a buy sell trade call. Trade at your own will. Use stop loss too.

AXISBANK – Classic Cup & Handle Breakout | Targeting 1280 & 1320🧠 Technical Analysis:
AXISBANK has formed a textbook Cup and Handle pattern over the past few months. The breakout above the resistance zone around ₹1199 marks a potential start of a new bullish rally.
🔹 Cup Formation: Rounded bottom between Dec 2024 - Apr 2025
🔹 Handle Formation: Consolidation range in Oct - Dec 2024
🔹 Breakout Candle: Strong bullish candle with increasing volume
🔹 200 EMA: Price is now well above the 200 EMA, adding to the bullish bias
🎯 Targets:
Target 1: ₹1280
Target 2: ₹1320
These levels are based on the measured move technique and previous swing highs.
🛡️ Support:
Immediate support lies around the breakout zone near ₹1199
Next strong support is near ₹1090 (200 EMA)
📊 Volume:
Breakout accompanied by a surge in volume confirms buyer interest and validates the pattern.
📌 Conclusion:
AXISBANK is showing strong bullish momentum with a confirmed breakout from a well-defined Cup and Handle formation. As long as it sustains above ₹1199, the stock could potentially rally toward ₹1280 and ₹1320 in the coming sessions.
📅 Keep it on your radar for bullish continuation setups!
Disclaimer:
This analysis is shared purely for educational and informational purposes and should not be considered as financial advice or a recommendation to buy or sell any security. Always do your own research and consult with a qualified financial advisor before making any investment decisions. Trading and investing involve risk.

AXISBANK 1190 - trend directionAXIS Bank 1190 - has given breakout but as signals are diverging we are negative with the breakout. Fib measured resistance 1214 need to be crossed for bullish confirmation. if fails it will drop back to 1000.

Axis Bank left bearish zoneAxis bank just left bearish zone and entered bullish zone.
Note. This is not a buy sell trade call.

AXISBANK(13 March 2023)→Type of trade:BREAKOUT TRADE(TC09)AXIS BANK (13 March 2023) → Type of trade: BREAKOUT TRADE (TC09) (IN FOLDER)
→ Result of Breakout in hindsight : It was a GENUINE BREAKOUT
RED STICKER - SHORT TRADE - HORIZONTAL LINE BREAKDOWN
---------------------------------------------------------------------------------------------------------------
TRADE OVERVIEW
---------------------------------------------------------------------------------------------------------------
WHEN WE IDENTIFIED THIS SETUP? OFF-MARKET HOURS (DURING H.W) OR LIVE MARKET?

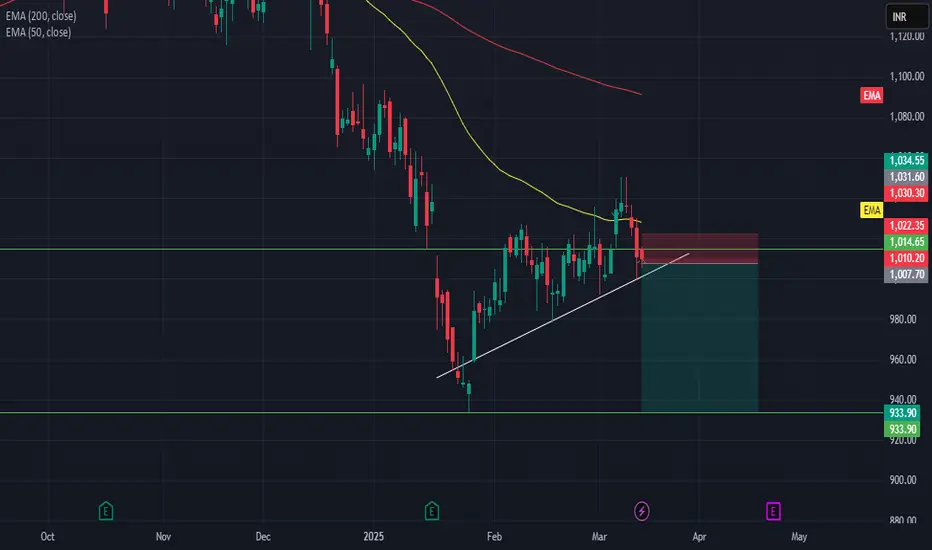
Axis Bank Short Position Axis bank has formed a Death Crossover on chart i.e 50 and 200 Ema Forming a Crossover leading to Downtrend of the prices . The price after making a lower high taking resistance from 50 EMA and now it is moving towards prev. low swing again and seems like it has weakness and could break trendline . Also there is a news Catalyst which is of Indusind Bank which will also help price to move towards low areas .