Axis Bank-Bullish Swing- Strong Supply zone!!
12.08.2024
Buy 1163
Target 1260
Stop Loss 1115
Risk Reward- 1:2
1. Inside bar breakout after good consolidation
2. Weekly Doji breakout
3. 200 EMA Rejection
4. Price rejected at 0.618 Fibonacci level
5. Gradual decrease in volumes in downtrend.
6. Strength of bear candles reduced.
7. RSI has reached over sold and now recovered to 40
8. Price rejection at resistance turned to support zone
NSE:AXISBANK
AXISBANK trade ideas

Axis Bank Ltd view for Intraday 19th September #AXISBANK Axis Bank Ltd view for Intraday 19th September #AXISBANK
Buying may witness above 1252
Support area 1230. Below ignoring buying momentum for intraday
Selling may witness below 1230
Resistance area 1250-1252
Above ignoring selling momentum for intraday
Charts for Educational purposes only.
Please follow strict stop loss and risk reward if you follow the level.
Thanks,
V Trade Point

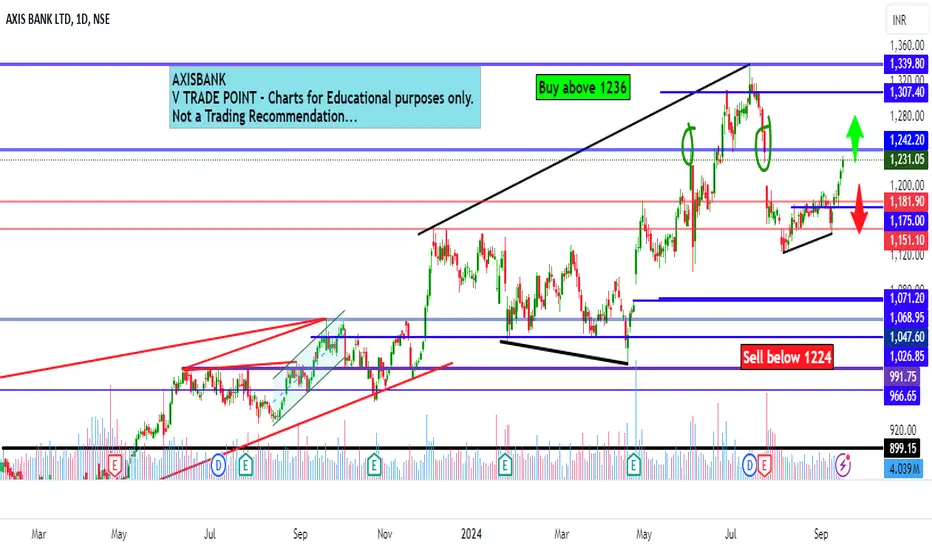
Axis Bank Ltd view for Intraday 18th September #AXISBANK Axis Bank Ltd view for Intraday 18th September #AXISBANK
Buying may witness above 1242
Support area 1223-1225. Below ignoring buying momentum for intraday
Selling may witness below 1224
Resistance area 1240-1242
Above ignoring selling momentum for intraday
Charts for Educational purposes only.
Please follow strict stop loss and risk reward if you follow the level.
Thanks,
V Trade Point

Ascending triangle | Trend continuation | Intradayhey Traders,
An intraday entry awaiting.
Its a ascending triangle breakout and works as a trend continuation.
Enter after the triangle breakout, make an aggressive entry.

Axis Bank Ltd view for Intraday 17th September #AXISBANK Axis Bank Ltd view for Intraday 17th September #AXISBANK
Buying may witness above 1236
Support area 1224. Below ignoring buying momentum for intraday
Selling may witness below 1224
Resistance area 1236
Above ignoring selling momentum for intraday
Charts for Educational purposes only.
Please follow strict stop loss and risk reward if you follow the level.
Thanks,
V Trade Point
Axis Bank longAxis BankI (Nse)
MTF Analysis
Axis BankI Yearly Demand Breakut 867
Axis BankI 6 Month Demand Breakout 1151
Axis BankI Qtrly Demand Breakout 1151
Axis BankI Monthly Demand Breakout 1151
Axis BankI Weekly DMIP 1156
Axis BankI Daily Demand BUFL 1141
ENTRY 1156
SL 1120
RISK 36
Target 1522
REWARD POINT 366
Last High 1339
RR 10.17
RR 32%

AXIS short DailyThis could be the potential level from which price turned around in oast & could be a TCP

Axis BankImportant points marked.
*****Education purpose only*****
*****Investing in Equity is subjected to market risk do own research before investing*****

Axis Bank Ltd breaks key levels, bullish momentum building!➡️ Bullish breakout above ₹1,199.70, with next target at ₹1,324.3

AXIS BANK HAS BROKEN THE RESISTANCE!AXIS BANK has broken the short-term resistance level successfully. A small upmove may be seen from here.

Inverted H&S pattern | FNO Strategy |Protective PUTAxis bank is at the verge to break the inverted H&S pattern at Daily timeframe.
Breakout level : 1194.30 in daily
Enter after the breakout.
Target : 1339.65
Risk : Reward 1:2.14
FNO strategies : Protective PUT or BULL CALL spread


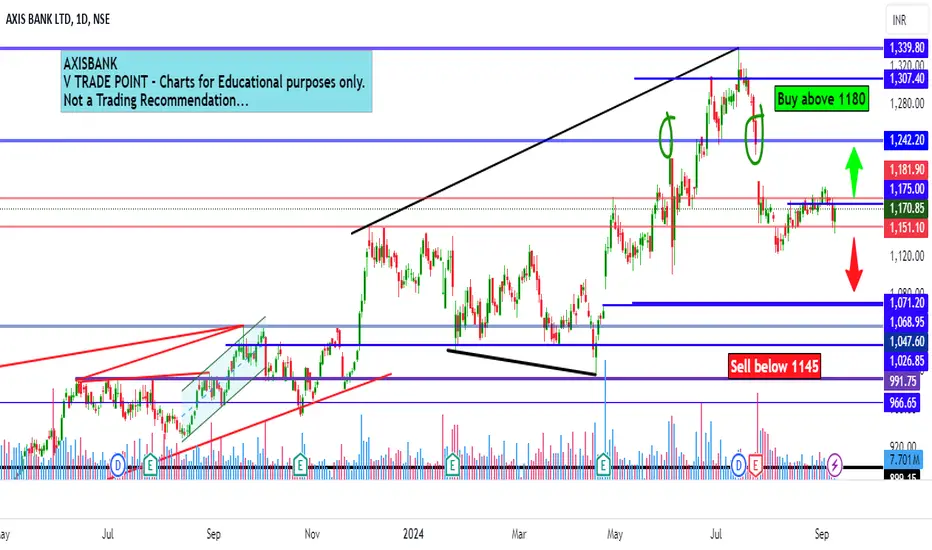
Axis Bank Ltd view for Intraday 10th September #AXISBANK Axis Bank Ltd view for Intraday 10th September #AXISBANK
Buying may witness above 1180
Support area 1160. Below ignoring buying momentum for intraday
Selling may witness below 1145
Resistance area 1160
Above ignoring selling momentum for intraday
Charts for Educational purposes only.
Please follow strict stop loss and risk reward if you follow the level.
Thanks,
V Trade Point
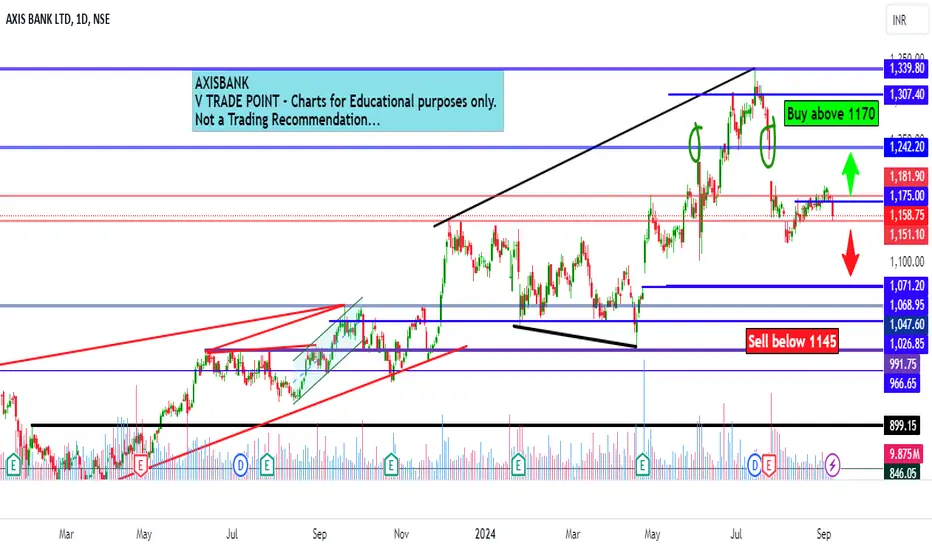
Axis Bank Ltd view for Intraday 9th September #AXISBANK Axis Bank Ltd view for Intraday 9th September #AXISBANK
Buying may witness above 1170
Support area 1160. Below ignoring buying momentum for intraday
Selling may witness below 1145
Resistance area 1160
Above ignoring selling momentum for intraday
Charts for Educational purposes only.
Please follow strict stop loss and risk reward if you follow the level.
Thanks,
V Trade Point
Axis Bank Ltd view for Intraday 5th September #AXISBANK Axis Bank Ltd view for Intraday 5th September #AXISBANK
Buying may witness above 1192
Support area 1180. Below ignoring buying momentum for intraday
Selling may witness below 1169
Resistance area 1180
Above ignoring selling momentum for intraday
Charts for Educational purposes only.
Please follow strict stop loss and risk reward if you follow the level.
Thanks,
V Trade Point

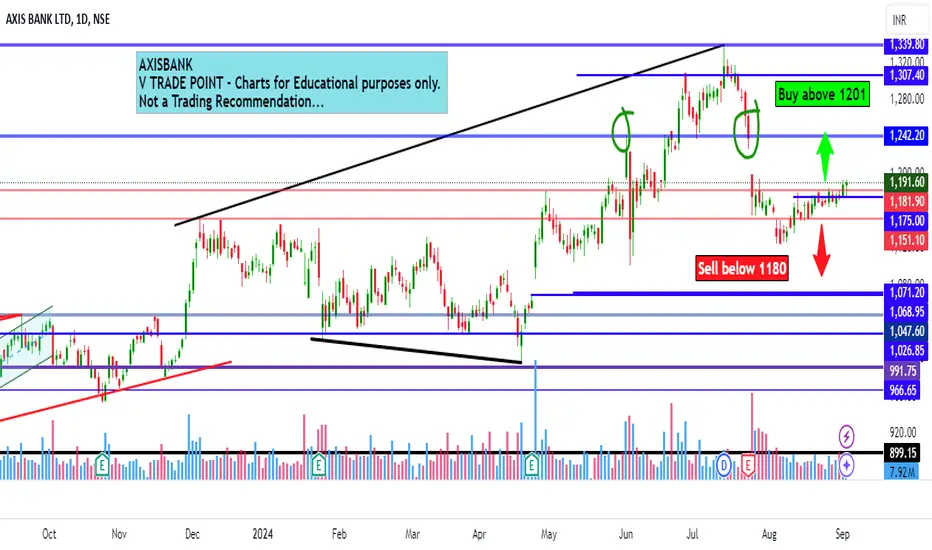
Axis Bank Ltd view for Intraday 4th September #AXISBANK Axis Bank Ltd view for Intraday 4th September #AXISBANK
Buying may witness above 1201
Support area 1180. Below ignoring buying momentum for intraday
Selling may witness below 1180
Resistance area 1200
Above ignoring selling momentum for intraday
Charts for Educational purposes only.
Please follow strict stop loss and risk reward if you follow the level.
Thanks,
V Trade Point
Axis bank has a chance to ace it..Axis Bank Ltd. engages in banking and financial services. It provides financial solutions to retail, small and medium enterprises, government, and corporate businesses. It operates through the following segments: Treasury, Retail Banking, Corporate or Wholesale Banking, and Other Banking Business. The Other Banking Business segment encompasses para banking activities such as third party product distribution advisory and other banking transactions.
Axis Bank Ltd. CMP is 1188.80. The positive aspects of the company are low Valuation (P.E. =13.8), Company with Zero Promoter Pledge, Increasing Revenue every Quarter for the past 8 Quarters, Mutual Funds Increased Shareholding over the Past Two Months, MFs increased their shareholding last quarter and Book Value per share Improving for last 2 years. The Negative aspects of the company are Poor cash generated from core business, declining Cash Flow from Operations and Increase in Provisions in the recent results.
Entry can be taken after closing above 1191 Targets in the stock will be 1206, 1243 and 1270. The long-term target in the stock will be 1292, 1313 and 1337. Stop loss in the stock should be maintained at Closing below 1127.
The above information is provided for educational purpose, analysis and paper trading only. Please don't treat this as a buy or sell recommendation for the stock. We do not guarantee any success in highly volatile market or otherwise. Stock market investment is subject to market risks which include global and regional risks. We will not be responsible for any Profit or loss that may occur due to any financial decision taken based on any data provided in this message.

View1177 is the level. If 30 min candle closes above 1177 level tomorrow then you can go long in Axis Bank. You can buy Axis bank sept futures or Axisbank 1180 AUG PE. Keep SL at 50% of premium received . Example if you short Put @12 then keep SL @18 and book SL in futures if the Option premium reaches 18.

AXIS BANKThe price might break through the resistance level and reach a new all-time high in the future
I'm not a SEBI-registered analyst. All posts and levels shared are just for educational purposes. I'm not responsible for any losses or profits. No claims, all rights reserved.

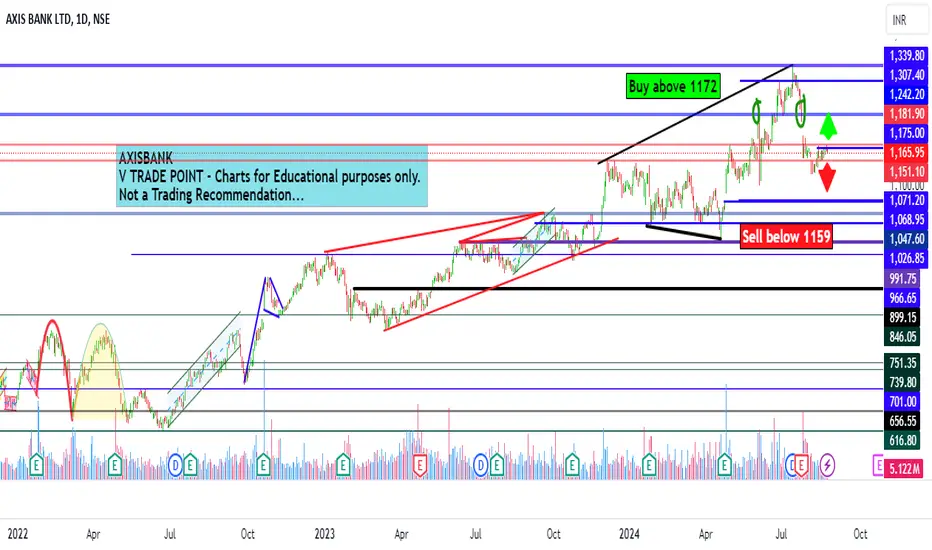
Axis Bank Ltd intraday level for 26th Aug #AXISBANK Axis Bank Ltd intraday level for 26th Aug #AXISBANK
Buying may witness above 1172
Support area 1170. Below ignoring buying momentum for intraday
Selling may witness below 1159
Resistance area 1159-1160
Above ignoring selling momentum for intraday
Charts for Educational purposes only.
Please follow strict stop loss and risk reward if you follow the level.
Thanks,
V Trade Point
Axis bank ltd intraday level for 19th Aug #AXISBANK Axis bank ltd intraday level for 19th Aug #AXISBANK
Buying may witness above 1172
Support area 1159. Below ignoring buying momentum for intraday
Selling may witness below 1159
Resistance area 1172. Above ignoring selling momentum for intraday
Charts for Educational purposes only.
Please follow strict stop loss and risk reward if you follow the level.
Thanks,
V Trade Point

Axis Bnak upside target 1200 to 1280 Axis Bnak may see a bullish reversal in the coming week, the stock has seen a decline of about 20 percent in the last one month, the stock is forming a base on its support from where reversal can be expected.
#Weeklyanalysis

AXISBANK Long Position Hi traders,
The price is approaching key support and we are expecting the temporary bounce.
Entry at 1,124.80
Target placed at 1,228.65
Stop loss at 1,108.60
Good luck
