BAJAJCON : can we expect up move!??BAJAJCON; seems like it is formed BC leg of AB=CD pattern. can we expect long here !? Watch the price at Watch out zone and go long !
BAJAJCON trade ideas

Bajaj Consumers Bajaj Consumers, Daily Time Frame,
Given Trendline Bullish Breakout
It's like ascending triangle pattern,
Along with Bullish UNGALI SETUP,
Weekly and Daily both MACD are positive and Aligned with Oscillators too.
All EMAs are Positive as per Requirement for Bullish Bias, One can go Long with Stop-loss of 268.
All key levels are mentioned in chart with Stop-loss and Targets.
Disclaimer
I am not sebi registered analyst
My studies are Educational purpose only
Please consult with your Financial advisor before trading or investing


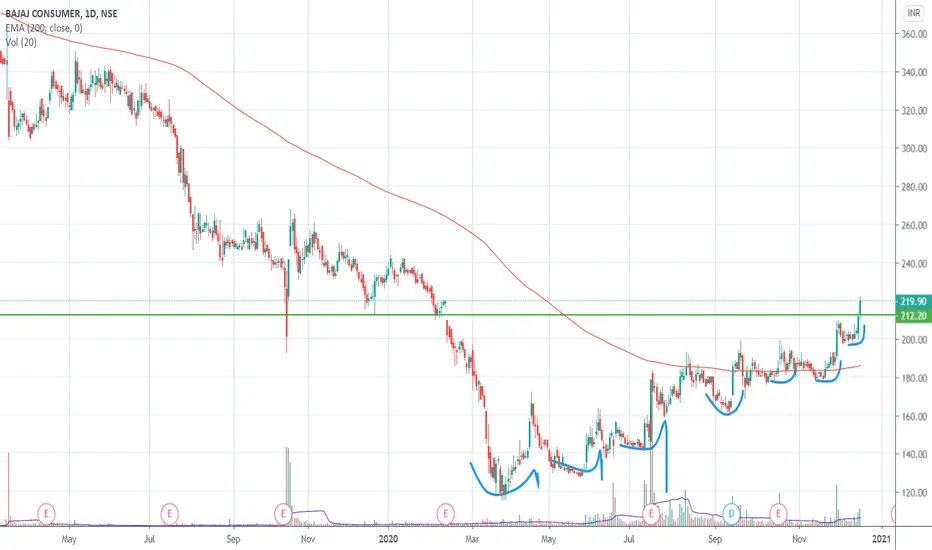
Bajaj Consumer - All set for next upmovePrice has been consolidating in a narrow range for over 4 weeks. Stock can be considered in a pullback phase as suggested by the low volumes and holding of the previous breakout area. Company has been reported fantastic quarterly earnings which has been well received by the market participants. Outside the consolidation area, stock can see 310/350 in short term. Entering at current market price has a low risk:reward ratio.


BAJAJCON ready for break out, but facing resistance BAJAJCON rested R2 and R3 resistance and returned and took support at 237. Re-testing R2 and R3. Potential chances for breakout to upside but with caution!


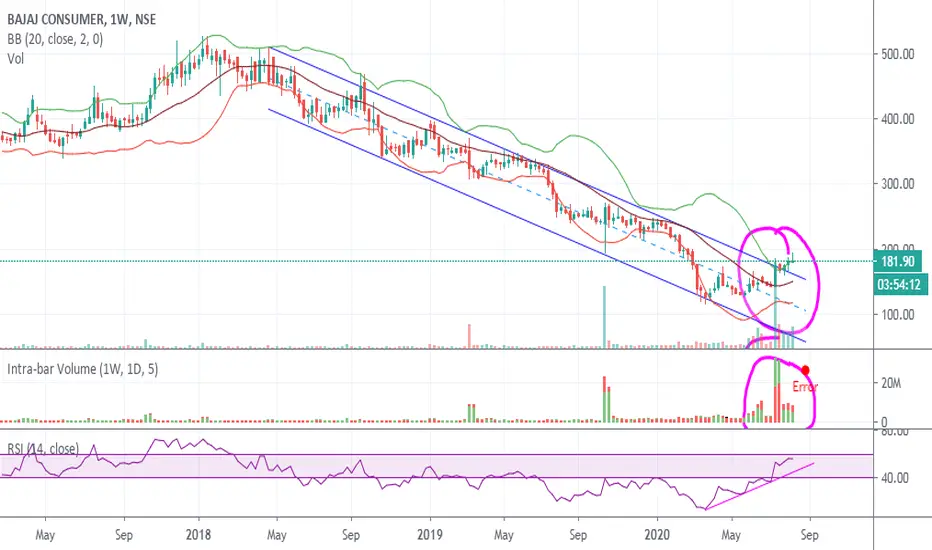
BAJAJ CONSUMER - Price at crucial level - Chart StudyThe above analysis is done purely based on price action and chart patterns.
The analysis is done on daily TF hence price may take few days to few weeks in order to reach the targets. Traders can take advantage of this analysis in intraday trades as well.
In technical analysis, we say that a level/zone which first acts as a resistance for price, becomes support if the price breaks that level/zone.
Also, a breakout is considered as good, if it is confirmed by increased volume.
If the price corrects thereafter with smaller volume candles, it only means that the big hands that have entered or went long in the stock has not exited and this is just a small retest or retracement part.
Keeping in mind the above learning, if we observe the chart, we can see that after falling for more than 2 years from its ATH levels, price took support at a zone which had acted as resistance for the price when price was trying to start its upward rally in 2011.
Thereafter the price has been making higher highs and higher lows continuously - sign of an uptrend.
The price was trading in an ascending channel pattern for last 9-10 months before giving a huge breakout from it on 03rd Feb. The breakout was confirmed by huge volume candle. It was a breakout from the trendline as well (a trendline formed by connecting three swing highs of past and then simply extending it further - as shown in image itself).
Thereafter profit booking started in the stock and price started falling. But we can clearly see that price is trying to take support at that crucial zone. And the volume candle is also smaller.
Hence, this can be just a retest before resuming its upward rally.
Now on Monday, one can either wait for price to touch its support level (upper limit of channel or trendline) and then take entry. Or one can start accumulation between 248-258 range.
SL can be placed either near 230 or for safe traders, they can put SL below the low of breakout candle, which is 213.
First Target will be the next swing high (zone marked with green rectangle). Traders can thereafter trail their SL to ride the rally or book their profits and exit completely.
Pls note that the above analysis is purely for educational purpose. Traders must do their own study before entering into any trade. Traders must trade as per their own risk taking capacity and money management
Feel Free to comment for any queries regarding the above stock or price action analysis in general.
Also check out my other ideas to understand how price action works and how it can be used to make regular profits without any complex strategies.

Bajaj Consumer - LongBajaj Consumer CMP - 207.30
Looking bullish in higher time frame. One can go for Intraday / Swing Trade setup with the following entry, exit & targets
Buy range 200 - 203 / Stop Loss - 195
Target 1 - 205
Target 2 - 207
Target 3 - 210 / 215
Swing / Short Term Target - 230
Disclaimer: This is my view and for educational purpose only.


Bajaj Consumer - I am ready to go up higherBajaj Cons - Breaking out of a long consolidation. Notice the super volatility contraction.
DISC: Not a SEBI Registered. I post charts for my own study.
BAJAJCON - Volume BreakoutBAJAJCON has given a breakout above resistance with good volume. Entry, SL, Targets updated on chart.
These idea's are not my recommendation. Do your own analysis before making any trade based on this idea.

BAJAJ CONSUMER BAJAJ CONSUMER on its critical area any time we can expect a good upmove.
only for practice and education


Easy intra points buy it was too late TRADE BASED ON
1. PRICE ACTION
2. TREND LINE
3. RSI.4.
4. FIBO STRATEGY


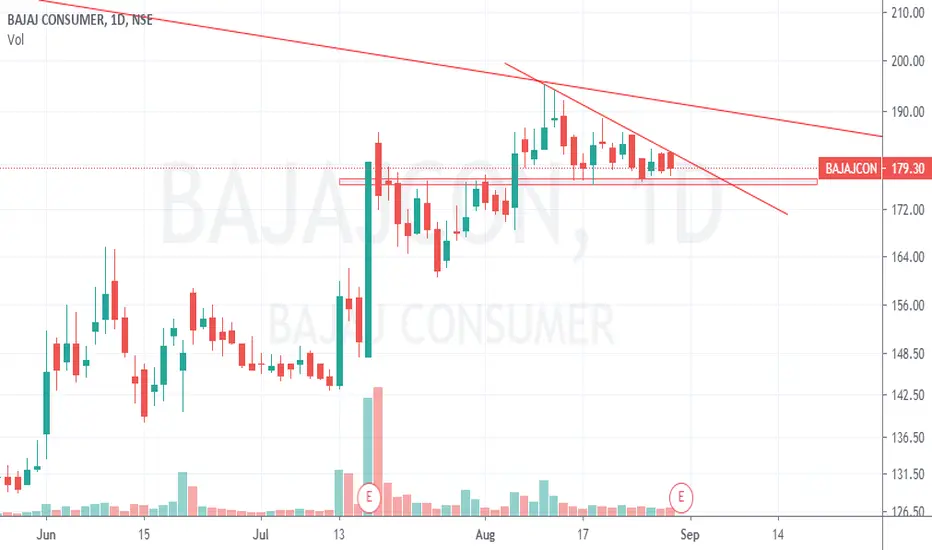
Bajaj Consumer - Range Breakout Bajaj Consumer CMP - 192.30
Buy @ 190 - 195 / Stop Loss - 176
Target 1 - 205
Target 2 - 215
Target 3 - 230
Target 4 -
Note: This is just for educational purpose only.

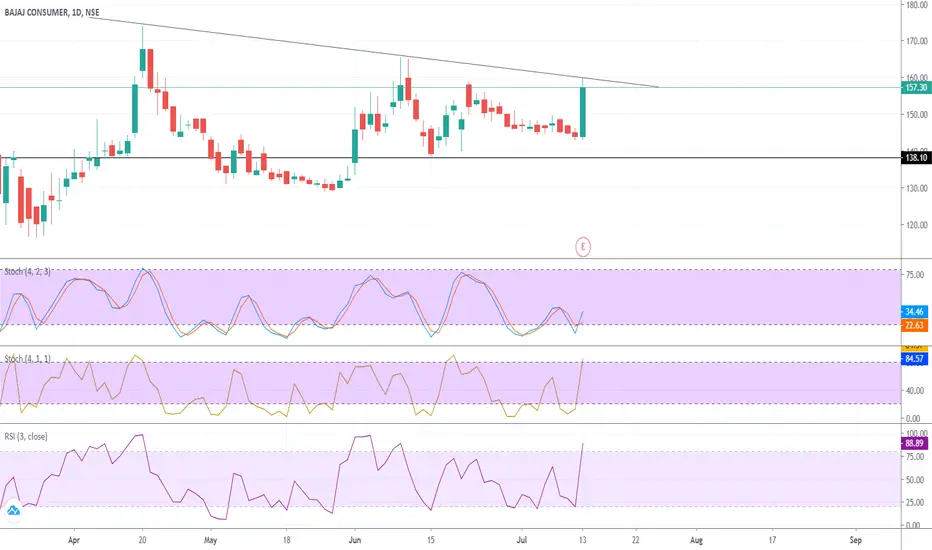
BAJAJCONSUMER#BAJAJCONSUMER
A Breakout from this Trend line in Daily TF would trigger good up movement
Use in 15 mins TF for Intraday
View Nuetral to Bullish
BAJAJCONBAJAJ CONSUMER
In ascending triangle pattern
The stock is above 200SMA
Watch for break out and trade.
View Bullish

bajaj con can give break out from ascending triangle bajaj con can give break out from ascending triangle

BAJAJ CONSUMER - Looks goodA breakout from a symmetric triangle with good volume and the RSI has some space to get into the overbought category. On this line I reckon this stock can meet its first target in a week or two.
A little bit of consolidation in the beginning of the week cannot be ruled out as well, which in fact, would be a healthier sign to accumulate.