BAJAJ ELECTRIC technical analysis Stock Overview: Bajaj Electricals Ltd. (BAJAJ ELECT.LTD) on the NSE exchange, current price: 686.70 INR. The company is a leading Indian manufacturer and marketer of electrical appliances, lighting, and fans, along with engineering and project services.
Key Levels:
Support Level: 488.70 INR
Swing Level: 589.05 INR
Possible Upside Levels: 1,227.30 INR 1,427.70 INR 1,683.00 INR
Technical Indicators:
- RSI (Relative Strength Index): The RSI is currently at 40.55, indicating neutral momentum. The stock is neither overbought nor oversold, suggesting a consolidation phase.
- Volume: Volume trends are crucial for assessing price movement strength. While the image does not explicitly show volume data, monitoring volume spikes can help confirm breakout or reversal signals.
Sector and Market Context:
Bajaj Electricals Ltd. operates within the consumer goods sector, focusing on electrical appliances and engineering services. The sector has shown resilience due to urbanization, rising disposable incomes, and government-led infrastructure initiatives. The broader market has been bullish, recovering strongly post-pandemic, driven by economic fundamentals and investor confidence. Bajaj Electricals Ltd. benefits from these trends due to its diversified product portfolio and strong brand presence.
Latest News and Developments:
- Market News: Bajaj Electricals Ltd. has announced a strategic partnership with a global firm to enhance product offerings and expand market reach.
- Analyst Ratings: Analysts have provided mixed ratings, with some recommending a hold due to market conditions, while others see long-term growth potential.
- Quarterly Results: The company reported strong revenue and net profit growth, attributed to robust consumer goods sales and successful engineering projects.
- Dividends: Bajaj Electricals Ltd. has declared a dividend payout of ₹3.00 per share (150%), reinforcing its commitment to shareholder value.
Analysis Summary:
Bajaj Electricals Ltd. exhibits solid sector performance, supported by favorable market trends and strategic initiatives. The identified key levels provide a framework for potential price movements. The RSI suggests neutral momentum, indicating a consolidation phase. Investors should consider the company’s strong quarterly results and strategic partnerships as positive indicators for future growth. However, market conditions and volume trends should be monitored for informed decision-making.
BAJAJELEC trade ideas

Bajaj Elec Buy trendDown trend changed to buy now 731 target for now.
on 5th earnings announcement there so may be it will touch on that date probably

Intraday Buy Call – Bajaj Electricals Ltd (NSE)### **📈 Intraday Buy Call – Bajaj Electricals Ltd (NSE) 🔥**
### **🕵️ Candlestick Pattern Analysis:**
✅ **Strong Bullish Reversal Candlestick** near key support **650.55**
✅ **Long wick rejection** suggests buying pressure at support
✅ **Breakout from downtrend possible** if price crosses above the 50-day moving average
---
### **🎯 Intraday Trade Plan – Buy Setup**
🔹 **Buy Above:** **675** (Confirmation of strength)
🔹 **First Target:** **700**
🔹 **Second Target:** **725**
🔹 **Stop-Loss:** **650** (Below support)
📌 **Risk-Reward Ratio:** Favorable **1:2** for a safe trade
📌 **Confirmation Tip:** Watch for volume spike & sustained move above **675**

bajaj electrical pullback??bajaj electrical pullback?
Target around 1100
SL if it breaks support line
Educational purpose only and not buy sell recommendation

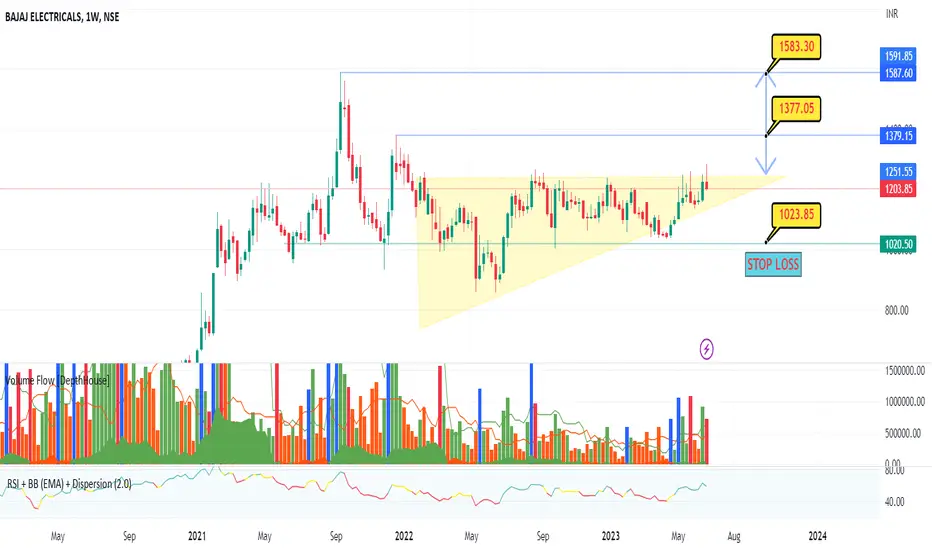
Weekly Bajaj electrical Long consolidated Huge consolidation.
Big pole and flag at monthly chart.
Good holding by institutions.
Can accumulate more at 850.
Medium term investment opportunity

Bajaj Electricals looks electrifying for the long termBajaj Electricals Limited was incorporated in July, 1938. The Company is engaged in business of consumer products (appliances, fans, lighting), EPC (illumination, power transmission and power distribution) and exports. Powered by a Pan-India presence and a market leading position in the industry, the Company functions through 20 branch offices which are duly supported by a chain of approximately over 700 distributors, 2.20 lakhs retail outlets and over 600 consumer care centres. The company has also a strong foothold in power transmission and distribution business.
Bajaj Electricals Limited CMP is 1003.90. The positive aspects of the company are Mutual Funds Increased Shareholding in Past Month, Dividend yield greater than sector dividend yield and Company with No Debt. The Negative aspects of the company are High PE (PE=94.8), Low durability companies, Declining profits every quarter for the past 2 quarters.
Entry can be taken after closing above 1022. Targets in the stock will be 1053, 1084, 1111 AND 1146. The long-term target in the stock will be 1189, 1274 and 1357. Stop loss in the stock should be maintained at Closing below 933 or 891 depending on your risk taking ability.
Disclaimer: The above information is provided for educational purpose, analysis and paper trading only. Please don't treat this as a buy or sell recommendation for the stock. We do not guarantee any success in highly volatile market or otherwise. Stock market investment is subject to market risks which include global and regional risks. We will not be responsible for any Profit or loss that may occur due to any financial decision taken based on any data provided in this message.

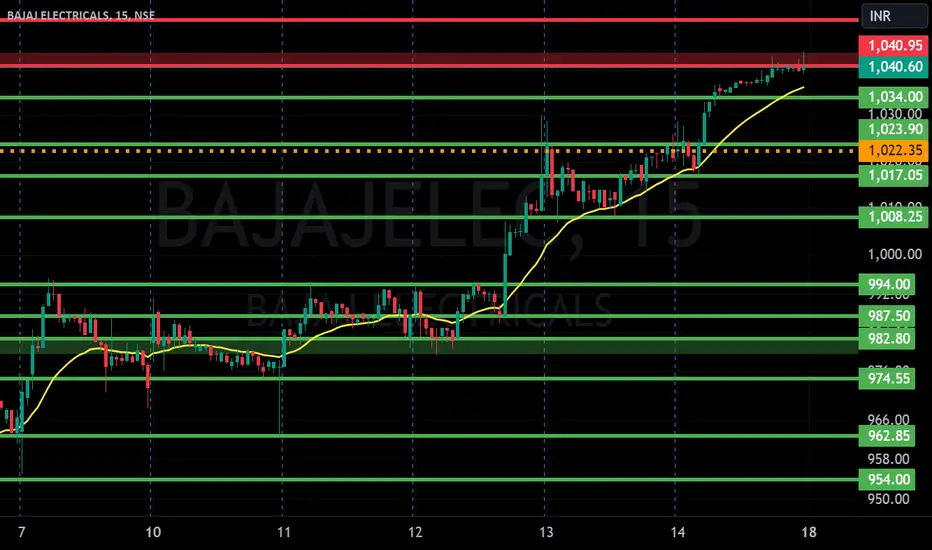
BAJAJ ELECTRICALS S/R for 5/7/24Support and Resistance Levels: In technical analysis, support and resistance levels are significant price levels where buying or selling interest tends to be strong. They are identified based on previous price levels where the price has shown a tendency to reverse or find support.
Support levels are represented by the green line and green shade, indicating areas where buying interest may emerge to prevent further price decline.
Resistance levels are represented by the red line and red shade, indicating areas where selling pressure may arise to prevent further price increases. Traders often consider these levels as potential buying or selling opportunities.
Breakouts: Breakouts occur when the price convincingly moves above a resistance level (red shade) or below a support level (green shade). A bullish breakout above resistance suggests the potential for further price increases, while a bearish breakout below support suggests the potential for further price declines. Traders pay attention to these breakout signals as they may indicate the start of a new trend or significant price movement.
20 EMA: The yellow line denotes 20 EMA, to interpret the 20 EMA, you need to compare it with the prevailing stock price. If the stock price is below the 20 EMA, it signals a possible downtrend. But if the stock price is above the 20 EMA, it signals a possible uptrend.
Disclosure: I am not SEBI registered. The information provided here is for learning purposes only and should not be interpreted as financial advice. It is important to consult with a qualified financial advisor before making any investment decisions. Tweets neither advice nor endorsement.

BAJAJ ELECTRICALS S/RSupport and Resistance Levels: In technical analysis, support and resistance levels are significant price levels where buying or selling interest tends to be strong. They are identified based on previous price levels where the price has shown a tendency to reverse or find support.
Support levels are represented by the green line and green shade, indicating areas where buying interest may emerge to prevent further price decline.
Resistance levels are represented by the red line and red shade, indicating areas where selling pressure may arise to prevent further price increases. Traders often consider these levels as potential buying or selling opportunities.
Breakouts: Breakouts occur when the price convincingly moves above a resistance level (red shade) or below a support level (green shade). A bullish breakout above resistance suggests the potential for further price increases, while a bearish breakout below support suggests the potential for further price declines. Traders pay attention to these breakout signals as they may indicate the start of a new trend or significant price movement.
Disclosure: I am not SEBI registered. The information provided here is for learning purposes only and should not be interpreted as financial advice. It is important to consult with a qualified financial advisor before making any investment decisions. Tweets neither advice nor endorsement.
Bajajelectricalthe chart analysis shows the long consolidation on wave 4 is complete and can go to complete the impulse cycle . confirmations would be as the price crosses the averages and breaks the upside prices in the coming weeks

Sideway in 1 hour timeframe #BAJAJELECNSE:BAJAJELEC is trading in sideway. It may break the resistance and go uptrend in future.
***Disclaimer: This analysis is purely for educational purpose and does not contain any recommendation. Please consult your financial advisor before taking any financial decision.***

LongIt forming inverse bullish pattern buy for 1200+ Target 🎯🎯 in near term .it is sector specific stock .here is rally pending for ATH as nifty is Moving towards 22000 and it is next sector that is outperform in coming quarter.

Caution AheadForming Reverse Cup an handle on weekly chart.
Watch for channel breakout. IF in tomorrow closing close above channel then this view is not valid.

Bajaj Electricals=> Bajaj Electrical Harmonic pattern
=>Using fib from C to D, 0.382 first target ,0.5 second target

Bajaj Electricals Buzzing AgainBajaj Electricals is the part of India’s leading business conglomerate the Bajaj Group. The company portfolio spans consumer products, lightning and EPC. The company has an expansive network of 18 branch offices, 600+ distributors, and more than 2.3 lakh retail outlets across India. Bajaj Electricals CMP is 1177.60.
The Negative aspects of the company are high valuation (P.E. = 64.4), declining cash from operations annual, FIIs are decreasing stake and MFs are decreasing stake. The Positive aspects of the company are improving annual net profits and no debt.
Entry after closing above 1206. Targets in the stock will be 1274 and 1329. Long term targets in the stock will be 1382 and 1400+. Stop loss in the stock should be maintained at closing below 1037.
Disclaimer: I am a NISM certified Research Analyst but have not registered for SEBI authorization. The purpose of sharing the views is purely educational in nature for paper trading only and for analysis. We will not be responsible for any profit or loss of any individual or institution which takes position based on our analysis.

BAJAJELECNSE:BAJAJELEC
One Can Enter Now ! Or Wait for Retest of the Trendline (BO) Or wait For better R:R ratio
Note :
1.One Can Go long with a Strict SL below the Trendline or Swing Low of Daily Candle.
2. Close, should be good and Clean.
3. R:R ratio should be 1 :2 minimum
4. Plan as per your RISK appetite
Disclaimer : You are responsible for your Profits and loss, Shared for Educational purpose

BAJAJELEC bearish viewbajajelec upcoming destination 1000-1040 with upside capped 1250-1285 in dcb. views negated closing above 1300 dcb twice.

BAJAJELEC - Bullish ConsolidationNSE: BAJAJELEC is closing with a bullish consolidation candle supported with volumes.
Today's volumes and candlestick formation indicates strong demand and stock should move to previous swing highs in the coming days.
The stock has been moving along the horizontal support for the past few days which is indicating demand.
One can look for a 8% to 12% gain on deployed capital in this swing trade.
The view is to be discarded in the event of the stock breaking previous swing low.
#NSEindia #Trading #StockMarketindia #Tradingview #SwingTrade

BAJAJ ELECTRICALS
Target and stoploss marked in chart
Market Cap
₹ 13,857 Cr.
Current Price
₹ 1,204
High / Low
₹ 1,284 / 920
Stock P/E
60.1
Book Value
₹ 170
Dividend Yield
0.33 %
ROCE
18.7 %
ROE
12.3 %
Face Value
₹ 2.00
Promoter holding
62.9 %
EPS last year
₹ 20.0
EPS latest quarter
₹ 5.10
Debt
₹ 101 Cr.
Pledged percentage
2.55 %
Net CF
₹ 222 Cr.
Price to Cash Flow
30.8
Free Cash Flow
₹ 375 Cr.
Debt to equity
0.05
OPM last year
6.60 %
OPM 5Year
5.46 %
Reserves
₹ 1,938 Cr.
Price to book value
7.06
Int Coverage
7.66
PEG Ratio
4.18
#BAJAJELEC #BAJAJHCARE #BAJFINANCE #BAJAJHIND #BAJAJFINSV #BAJAJ#BAJAJELEC
NSE: BAJAJELEC
CMP: 1191
TP: 1500
SL: 1055
TF: <6m
RR > ~2 times
Return > 25%
BAJAJELEC BAJAJHCARE BAJFINANCE BAJAJHIND BAJAJFINSV BAJAJHLDNG BAJAJ_AUTO BAJAJCON
HAVELLS
Factors:
BULLISH WEDGE BREAKOUT
Trend Following
Rising Volume with rising Prices.
Flag pattern breakout.
Pennant Pattern Breakout with Bullish Candle.
Retest Successful.
Higher Highs & Higher Lows.
Broken above RESISTANCE levels
Trading at SUPPORT levels
Earnings are strong.
Bullish Wedge Breakout
Risk Return Ratio is healthy.
And
Rising from Double Bottom Pattern to Flag Pattern forming.
If you like my work KINDLY LIKE SHARE & FOLLOW this page for free Stock Recommendations.
With 💚 from Rachit Sethia

bajaj elictricif bajaj electric break 4 hr red candle high then buy it for swing trading , otherwise leave it buy stay focused when it break out it gives you 14 16 % in just 1 month ... same triengle it formed on previous year and breakout ...

bajaj elictricif bajaj electric break 4 hr red candle high then buy it for swing trading , otherwise leave it buy stay focused when it break out it gives you 14 16 % in just 1 month ... same triengle it formed on previous year and breakout ...

BAJAJ ELECNSE:BAJAJELEC
Note :
1.One Can Go long with a Strict SL below the Trendline or Swing Low of Daily Candle.
2. Close, should be good and Clean.
3. R:R ratio should be 1 :2 minimum
4. Plan as per your RISK appetite
Disclaimer : You are responsible for your Profits and loss, Shared for Educational purpose!

