BAJAJ FINSERV LTD. Cup & HandleBAJAJ FINSERV LTD. Cup and Handle Structure on weekly chart. place Stoploss according to Table shown in chart.
Regulatory Note: We are an independent development team. Our private indicator and services are not registered or licensed by any regulatory body in India, the U.S., the U.K., or any global financial authority. Please consult a licensed advisor before making trading decisions.
BAJAJFINSV trade ideas
BAJAJFINSV BUY PROJECTION Bajajfinsv - Buy View
Trade Setup :
Monthly - Strong Support and FIB 0.786
Weekly - Symmetric Triangle Breakout
Day - Higher High Formed (Uptrend)
Entry - Aggressive Trader(Entry Now)
Conservative Trader - 1588 Rs
Target 1 - 1925 Rs
Target 2 - 1971 Rs
Stoploss - 1514 Rs
Expected Return - 20 %

Baj Finserv Bajaj Finserv
looks good in Parabolic uptrend. Recently closed above the triangular marked zone and retesting it.
Can expect fresh rally.
BAJAJFINSRV - A BULLISH RALLY AFTER DOUBLE BOTTOMHUHH!!
This rally is still on!! After double bottom "w" pattern it crosse300+ pts.
Now there is a consolidation phase.

BAJAJFINSERV IS ready to fall sharp for short termBAJAJ FINSERV is ready to fall for short term till the level of 1823, so wait for short term and see the price action

Bajaj finserv technical analysisAs you can see the price is giving full respect to the trend line, 3 touches have been completed, so now we will wait for the market to fall till the resistance and then we will buy.
This is only for educational purpose do your own research before investing.

Bajaj Finserv: Preparing for a Big Move! 🚀 Bajaj Finserv: Preparing for a Big Move! 🚀
📍 CMP: ₹1798
📉 Stop Loss: ₹1615
🎯 Target: ₹2025 | ₹2500
🔹 Key Insights:
✅ Rounding Bottom Formation: Neckline at ₹2025—confirmation above this level could unlock strong upside potential.
✅ Channel Trading: The stock is moving within a well-defined upward channel.
✅ Macro Factor: Potential RBI rate cuts could act as a major catalyst.
✅ Strategy: Staggered entry to manage risk in a volatile market.
⚠️ Risk Management: Strict adherence to stop loss at ₹1615 is crucial.
📉 Disclaimer: As a non-SEBI registered analyst, I recommend conducting thorough research or seeking advice from financial professionals before making investment decisions.
#BajajFinserv #TechnicalAnalysis #BreakoutStrategy #SwingTrading #StockMarket

BAJAJFINSV | Buy @2000 | SL below 1800 | Target 2800Disclaimer:
This is not financial advice. Please do your own research or consult with a financial advisor before making any investment decisions. Investments in stocks can be risky and may result in loss of capital.

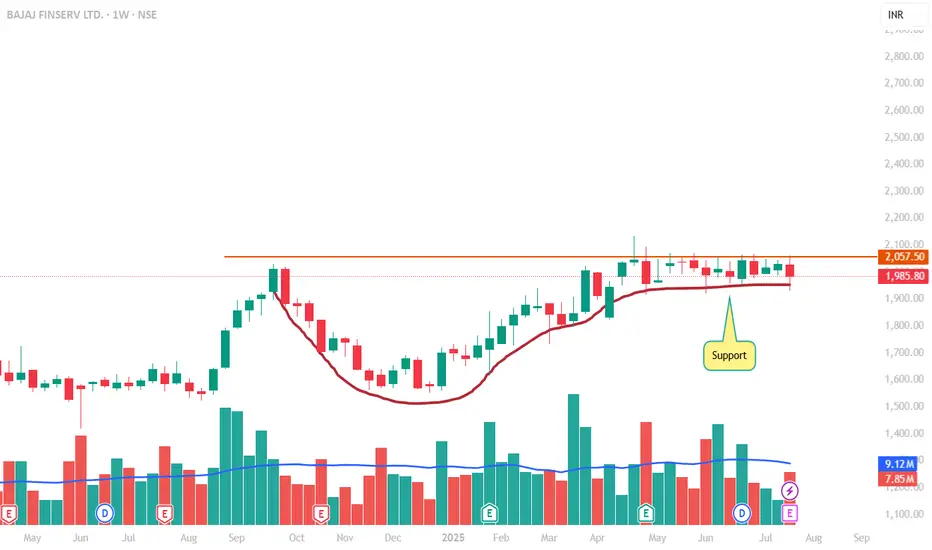
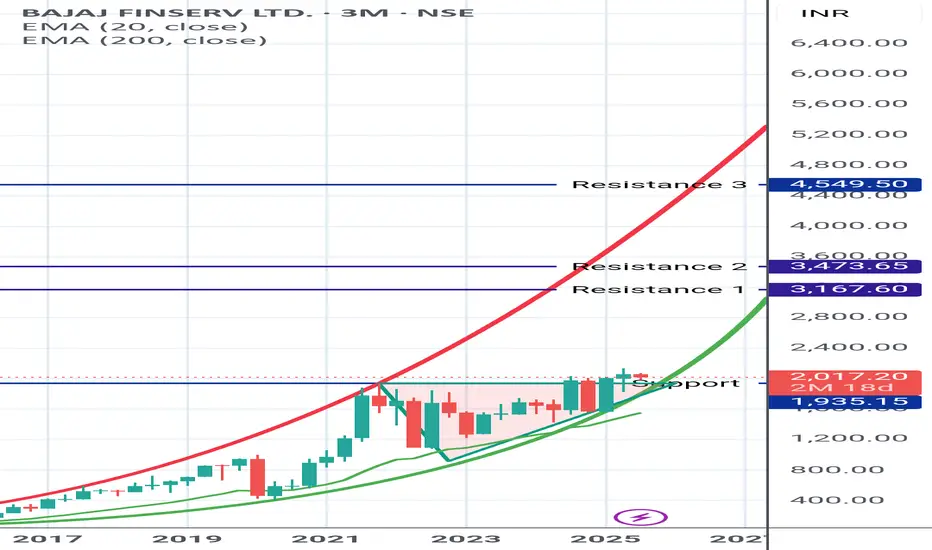
Bajaj Finserv Ltd scending Triangle formation on the monthly📌 Trade Setup: Bajaj Finserv Ltd (NSE)
Pattern: Ascending Triangle
Timeframe: Monthly
Signal: Approaching breakout of horizontal resistance zone
✅ Buy Recommendation
Buy above: ₹2,075 (Monthly close above resistance confirms breakout)
Aggressive entry: ₹2,035 (Current level with early risk)
Target 1: ₹2,400
Target 2: ₹2,750
Target 3: ₹3,000+ (Long-term projection from triangle height)
❌ Stop Loss
SL: ₹1,850 (Below recent swing low and trendline support)
for educational purposes only

Bajaj Finserv Shows Signs of Life — Brewing Breakout Ahead?"Hello, folks! Take a look at the chart — a breakout is forming on the weekly timeframe. If this breakout holds, we could potentially see a rally, even under current bearish market conditions."

BAJAJFINSERV Positional Trade Setup🚀 BAJAJFINSERV Positional Trade Setup
📊 Levels:
🎯 Entry: ₹2,000 (Breakout above ATH)
💰 Targets: ₹2,350 (17% upside)
🛑 Stop Loss: ₹1,850 (7.5% risk)
🔥 Catalysts:
Rate-cut expectations (RBI 2024)
Strong parentco (Bajaj Group)
ATH breakout momentum
📈 Technicals:
Supertrend (10,3): Bullish ✅
TEMA (5,9,20): Rising momentum
⚠️ Watch: Q4 earnings & RBI policy
💬 "Would you hold for 6M or book early? Comment!" 👇

Positional Trading Setup for Bajaj Finserv (NSE)📊 Technical Setup:
Current Price: ₹1,593.55 (-0.33%)
Range: ₹1,565 (L) – ₹1,612 (H)
Key Levels:
Support: ₹1,565 (Recent Low) / ₹1,500 (Strong Base)
Resistance: ₹1,612 → ₹1,700 → ₹2,085 (ATH)
Indicators:
Supertrend (10,3): Neutral (Watch for bullish flip above ₹1,620).
TEMA (5,9,20): Flat – Needs momentum breakout.
Trade Plan:
Entry: ₹1,580-1,600 (Dip near support)
Stop Loss: ₹1,530 (3-4% risk)
Targets: ₹1,700 (Intermediate) → ₹2,000+ (Positional)
RRR: 1:4 (₹50 risk → ₹200+ reward)
🏦 Business Overview:
Sector: Financial Services (NBFC)
Key Strengths:
Diversified Biz: Lending (Consumer/Commercial), Insurance, Wealth Mgmt.
Parent Backing: Bajaj Group’s strong brand & distribution.
Growth Drivers: Rural finance, digital lending, ULIP demand.
Risks:
Rising NPAs in unsecured loans.
RBI tightening norms for NBFCs.
🎯 Why This Trade?
Chart: Near support with ATH potential (+30% upside).
Fundamentals: ROE ~18%, PAT growth ~25% (5Y CAGR).
Sectoral Tailwind: Financials bullish in rate-cut cycle.
⚠️ Watch For: Q4 earnings (May’24) & RBI policy impact.

Positional setup seems to be forming in Bajaj FinservPositional setup in Bajaj Finserv is seen. It may take few weeks to reach the target. Cup and handle was recently confirmed. There is a possibility of positive move ahead.
Note: This is not a trading recommendation. This analysis is for educational purposes only. We'll know in few weeks if the price moved as per the study.
It is not advisable to go long when many market indices are still trending low.

Bajaj Finserv: Preempting a Major Breakout! 🚀 Bajaj Finserv: Preempting a Major Breakout! 🚀
📈 CMP: ₹2007 | SL: ₹1733 | Target: ₹2503
🔹 Breakout Above ₹2029 = All-Time High!
🔹 All-Time High Monthly Close Achieved
Why Bajaj Finserv Looks Strong?
✅ Technical Breakout: Rounding bottom pattern nearing completion
✅ Sector Strength: RBI's liquidity measures favor NBFC growth
✅ Finnifty Outperformance: Financial stocks showing resilience with strong weekly & monthly closes
💡 Strategy & Risk Management:
🔒 Stop Loss: ₹1733 to limit downside risk
📈 Staggered Entry: Phased accumulation to navigate volatility
⚠️ Caution: Market has rallied—adjust position sizing accordingly.
💬 Do you see financials leading the next rally? Share your views!
#BajajFinserv #BreakoutTrading #TechnicalAnalysis #NBFC #StockMarket #SwingTrading
📉 Disclaimer: Not SEBI-registered. Conduct independent research or consult a professional before investing.


Bajaj Finserv Breakout Bajaj Finserv Breakout Level
Buy it from 1950
Stoploss 1845
Target 2130,2340,2560

Bajaj Finserv Ltd parallel channelFollowing a upward parallel channel can give 7-8% in 1-2 months
1) increasing volume
2) 20 day breakout
3)above 100 EMA
4)showing strength

BAJAJFINSV Squeeze BO Expected March 2025CRS is Positive
Above all Major MA
Recent Pocket Pivot
Up side expected with markets support

BAJAJFINSVBAJAJFINSV
watch above levels. green line is our entry, redline is our SL.
DISCLAIMER : I am NOT a SEBI registered advisor or a financial adviser. All the views are for educational purpose only.

Long for Long Term - Discount price in terms of Revenue/shareAs seen in the Revenue Grid indicator, stock is currently trading at 2 to 2.5 times it's Revenue per share, which is a very low valuation historically. It crossed below this valuation, only at covid pandemic crash. Given the consistent Revenue increase, this is a fair value to buy for a long term view.


BAJAJFINSV | Short below 1867 with Strict SL as specified.Disclaimer:
This is not financial advice. Please do your own research or consult with a financial advisor before making any investment decisions. Investments in stocks can be risky and may result in loss of capital.

Bajaj Finserv Demand Zone Target Trading in the Zone!!!
A demand zone in trading refers to a price level or area on a chart where there is significant buying interest, leading to a potential reversal or pause in a downward trend. For Bajaj Finserv (or any stock), identifying a demand zone can help traders anticipate potential buying opportunities.
