BAJAJFINSV trade ideas


Bajaj Finserv (Consolidating above a crucial level)Bajaj Finserv has tried to break the range of 6150-6000 for quiet a while now but every time it has reversed to go and test its current high (last 3-4 months) (Check in the Daily TF it will give you a better idea) which has led to a channel formation. As the recent past has shown the stock does not spend a lot of time at these levels it has generally moved up.
The current consolidation in the hourly time frame might be an indication of a breakdown or a reversal.
Any side breakout should be a strong one however momentum might be affected due to the news in the market surrounding the Multi Cap Funds.
Keep an Eye.

INTRADAY STOCKS SELECTIONS ( 8/9/2020)A Rectangle is a continuation pattern that forms as a trading range during a pause in the trend. The pattern is easily identifiable by two comparable highs and two comparable lows. The highs and lows can be connected to form two parallel lines that make up the top and bottom of a rectangle.


BAJAJ FINSERV LTD 1HRBearish GARTLEY
Horizontal BLACK DOTTED lines r High & Low of ULTRA HIGH Volume CANDLE .Vertical dotted line is ULTRA HIGH VOLUME i.e SMART MONEY
ULTRA HIGH VOLUME for going SHORT we need LOW VOLUMES in the area of ULTRA HIGH VOLUME BAR.
IF Price breaks ULTRA HIGH VOLUME Candle LOW with LOW VOLUMES & with NO DEMAND l.e place for short
price need to follow Green Trend line & hit target
If price Breaks Red Trend line is where EXIT before SL hits
POTENTIAL SELL

BAJAJ FINSERV LTD 4HRBearish deep crab formed at Daily & 4hr RESISTANCE Level
IF Price breaks ULTRA HIGH VOLUME Candle LOW with LOW VOLUMES & with NO DEMAND l.e place for short
Potential SELL

BAJAJFINSERVNSE:BAJAJFINSV
BAJAJ FINSEREV IN CONSOLDIATION OUT SIDE THE BOX CAN GIVE GOOD MOVE
BUY RIFGHT SIT TIGHT
VIEWS INVITED


Possible breakoutPossible breakout as several times resistance has been tested at same level making it weak now, with another thrust from market could lead it to breaks its level, To be added in your watch list.


Bajajfinserv - Bullish view - Expecting price will move to 7000Bajajfinserv - Bullish view - Expecting price will move to 7000

BAJAJFINSERVBAJAJFINSERV
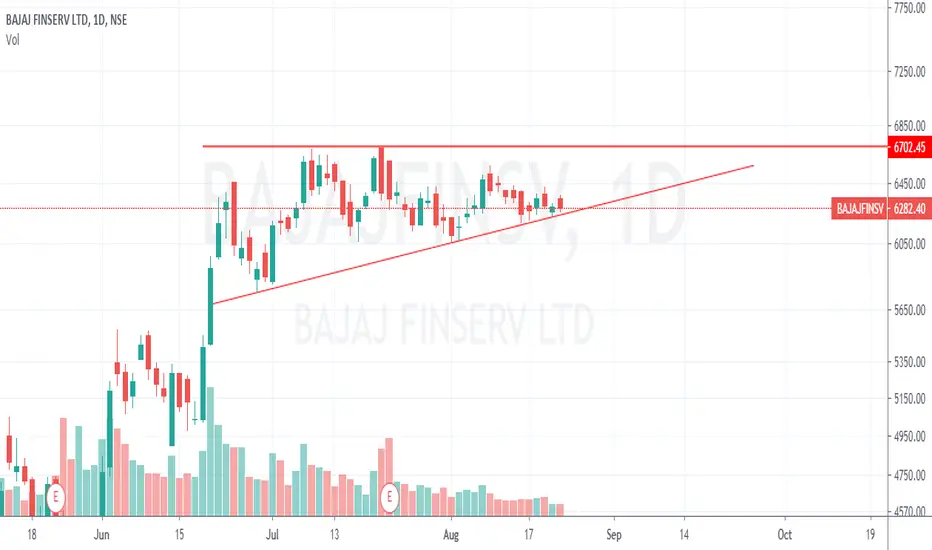
Ascending triangle Pattern
Support taken at lower trend line.??
Watch out for break/break down and trade accordingly.
View Neutral.