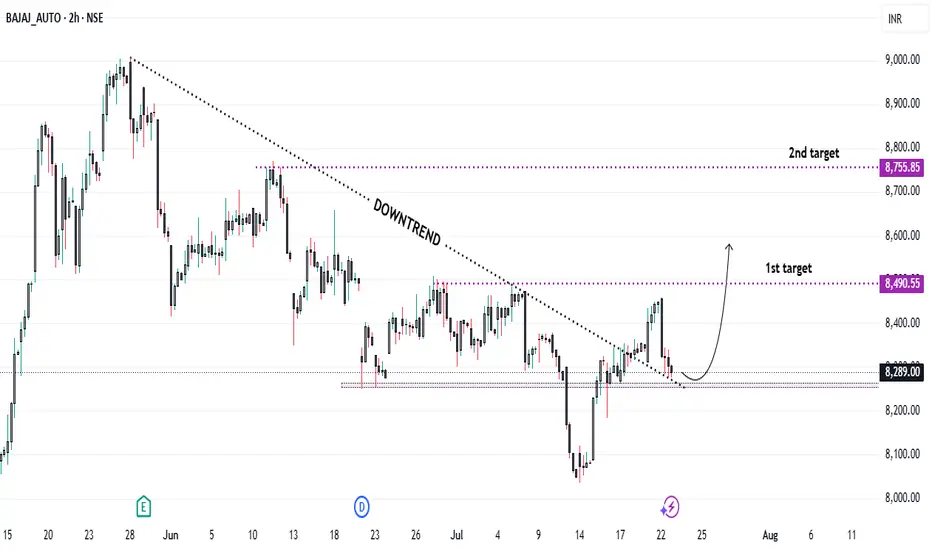
Trendline Breakout in Bajaj Auto: Buy Opportunity...?* Trend Overview:
* The stock has been in a downtrend over the past 2 months.
* Recently, it has broken the downward trendline and successfully retested the breakout, indicating a potential reversal.
* Current Price Action:
* Breakout above trendline confirms bullish momentum.
* The retest held above the trendline, adding further confidence for long positions.
* Support & Stop-Loss:
* Key support level identified at ₹8,250 – has acted as a demand zone in recent sessions.
* A stop-loss should be placed just below ₹8,250 to manage risk effectively.
* Target Levels:
* 🎯 Target 1: ₹8,490
* 🎯 Target 2: ₹8,755
* Important Note:
* ⚠️ Due to ongoing global geopolitical tensions, the overall market may remain volatile.
* Trade with proper risk management and position sizing.
BAJAJ_AUTO trade ideas
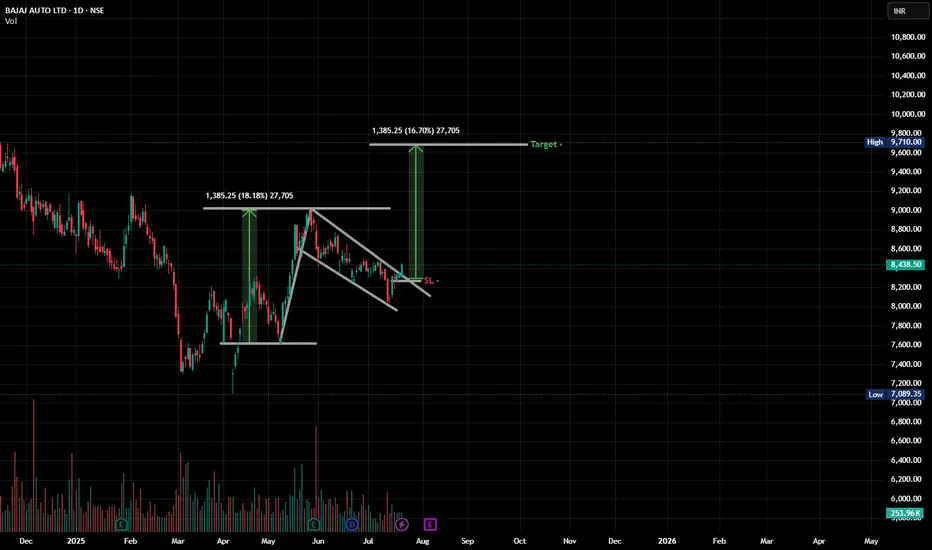
Ohohoho Pole and flag i see there!NSE:BAJAJ_AUTO Just did a noice breakout of a pole and flag there. minimal SL and a good enough target. 9020 may be a resistance
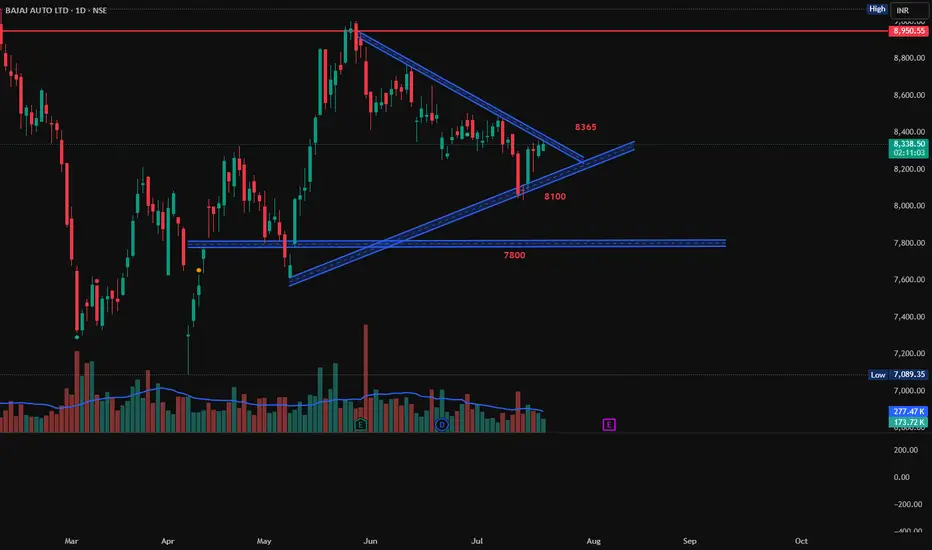
Bajaj Auto, Triangular PatternBajaj Auto is following a nice triangular pattern. Is both short and long side trade is possible on this stock. If it breaks above the pattern then enter on the breakout of 8365 with target 8950. If it break down below 8100 then target will be 7800.
Long
Entry: 8365
Target: 8950
Short
Entry: 8100
Target: 7800
Bajaj AutoThis is Bajaj auto chart
which is at 8410 ...
looking at the chart is see this structure...
in which from upside 5 waves have been completed...
and after that I see 3 waves upside correction being completed...
if price breaks downside levels ...
levels can be seen on charts till where i am expecting...
Just a View!!
Vedang!
Discliamer: Chart is for study purpose only!!

BAJAJ AUTO LTD – Trendline Breakout with Upside Potential NSE:BAJAJ_AUTO – Trendline Breakout (The setup offers a favorable risk-reward ratio, with potential for ~500+ points upside from the breakout zone.)
Chart Type: Daily (1D)
Current Price: ₹8,455
Structure: Falling wedge breakout with defined targets
Falling Wedge Formation:
The price has been consolidating within a falling wedge pattern, indicating a potential bullish reversal.
Both upper and lower trendlines (labeled as "small down trend") have been respected multiple times, validating the structure.
Breakout Confirmation:
A breakout above the descending trendline has occurred, accompanied by a bullish candle closing above the immediate resistance zone around ₹8,407.
This marks the breakout point and indicates a shift in momentum.
Support Zone:
Strong support has been established near ₹8,225.55, as marked on the chart.
This level can serve as a stop-loss for bullish positions.
-----
BUY: above 8410-8450
SUPPORT ( SL ) : 8220
RESISTANCE ( TGT) :8640-8780-9000+++

BAJAJ AUTO CMP 8400.(Positional,Investment porpose)After a long correction stock trading almost 30% discount from its all time high.It is a best opportunity.For long time players it is best time for entry in this stock.It giving a signal for bottom out with RSI comfirmation.Add this to your watchlist and see how it perform in coming days.

BAJAJ AUTO✅ Trade Setup Summary
Parameter Value
Trade Direction BUY
Entry ₹8,208
Stop Loss (SL) ₹7,950
Risk ₹258
Target ₹13,893
Reward ₹5,685
Risk-Reward (RR) 22.0
Last Swing High ₹12,774
Last Swing Low ₹7,089
🧠 Logic & Key Takeaways
Trend Alignment: All timeframes are clearly in an uptrend, showing full directional confluence.
Entry Zone: ₹8,208 sits right at the Daily & Intraday (ITF) demand zone, offering strong support for a bounce or continuation.
SL Positioning: ₹7,950 is right below both DMIP (Daily) and ITF BUFL zones — perfect positioning for controlled risk.
Reward Potential: An ambitious yet technically justified target of ₹13,893 implies a Reward of ₹5,685 on a ₹258 risk, giving an exceptional RR of 22:1.
Volume & Structure: Strong demand buildup from ₹7,600–8,300 provides ample base support for a breakout continuation.
⚠️ Risks / Watchouts
Aggressive Target: ₹13,893 is significantly higher than the last high (₹12,774); watch for selling pressure near previous peak.
Execution Sensitivity: Small entry delay/slippage can materially impact such a high RR trade. Precision matters.
Volatility Consideration: Given tight SL and wide target, trailing SL as the stock moves past ₹12,000 could protect gains.
📌 Verdict:
✅ Highly favorable BUY setup with:
Full uptrend alignment across timeframes
Strong daily/ITF demand zone confluence at entry
Very high RR of 22:1 — exceptional reward potential
📍 Monitor momentum and volume post-breakout. Start trailing SL after clearing ₹12,774 to lock in profits while targeting ₹13,893.
Here's a comprehensive breakdown of the BAJAJ AUTO trade plan with trend alignment, demand zone clarity, and risk-reward evaluation:
🔍 Multi-Timeframe (MTF) & High Timeframe (HTF) Analysis Summary
Timeframe Trend Demand Zone Type Proximal Distal Average
Yearly UP BUFL 6833 6560 6697
Half-Yearly UP BUFL 6833 6560 6697
Quarterly UP BUFL 6833 6560 6697
Monthly UP BUFL 8328 7301 7815
Weekly UP BUFL 8044 7612 7828
Daily UP DMIP 8208 7950 8079
ITF (60m–240m) UP BUFL 8208 7950 8079
📊 Averages Overview
Timeframe Group Trend Avg Proximal Avg Distal Avg of Averages
HTF Avg UP 6833 6560 6697
MTF Avg UP 8193 7621 7907
ITF Avg UP 8208 7950 8079

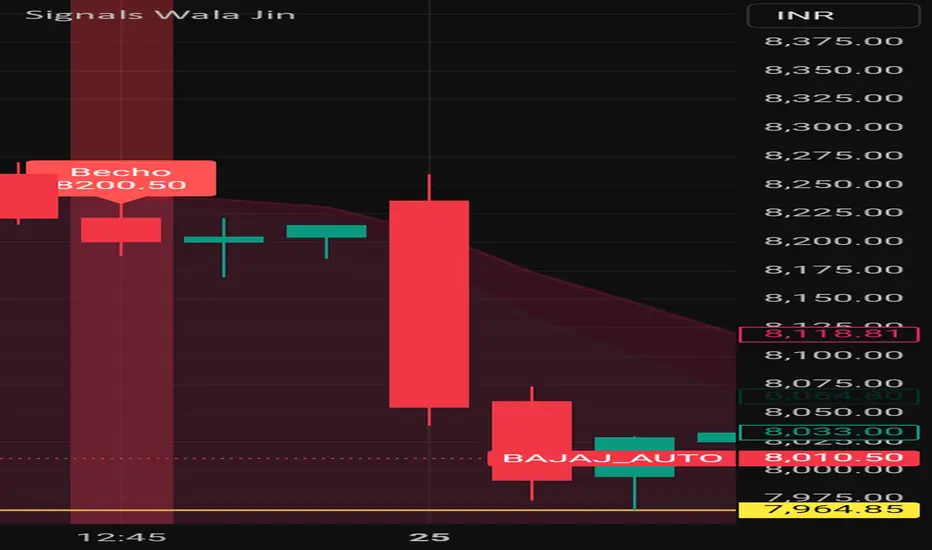
235 rupees dropped #BajajAuto share after signal 235 points dropped #BajajAuto share after generation of Signal "Becho" means sell by my custom designed indicator named SignalsWalaJin
Note: This is not a buy sell trade call. Trade at your own will. Use stop loss too.
BAJAJ AUTO | LONG | SWINGBAJAJ AUTO is showing a good Bullish signal. The buyers look to be in charge as the price has broken out from the lows of 7600 price levels with continuous HL & HH formations.
I've taken an option trade for a Target to 8300 price level.
P.S. Not a recommendation. Pls do your own research.

$BAJAJAUTO: Bajaj Auto – Wheeling to Wealth or Spinning Out?(1/9)
Good afternoon, everyone! ☀️ $BAJAJAUTO: Bajaj Auto – Wheeling to Wealth or Spinning Out?
With BAJAJAUTO at ₹7,711.25 post-CEO nod and ₹1,500 crore boost, is this two-wheeler titan revving up or stalling? Let’s ride into it! 🔍
(2/9) – PRICE PERFORMANCE 📊
• Current Price: $ 7,711.25 as of Mar 19, 2025 💰
• Recent Move: Up 1.64% on news, below $12,774 high, per data 📏
• Sector Trend: Auto sector steady, with two-wheeler demand in focus 🌟
It’s a smooth ride—value might be in gear! ⚙️
(3/9) – MARKET POSITION 📈
• Market Cap: Approx ₹2.12 lakh crore (web ID: 6) 🏆
• Operations: Two-wheelers, financing via subsidiary ⏰
• Trend: Leadership stability, credit growth, per data 🎯
Firm in its lane, with expansion in sight! 🚴♂️
(4/9) – KEY DEVELOPMENTS 🔑
• CEO Re-appointment: Rajiv Bajaj for 5 yrs from Apr 1, per data 🌍
• Investment: ₹1,500 crore into Bajaj Auto Credit Ltd., per data 📋
• Market Reaction: Stock up, signaling confidence 💡
Revving up leadership and capital! 🛵
(5/9) – RISKS IN FOCUS ⚡
• Market Volatility: Trade tensions, economic shifts 🔍
• Competition: Hero MotoCorp, TVS pressure sales 📉
• Rates: Rising costs could hit demand ❄️
It’s a twisty road—watch the turns! 🛑
(6/9) – SWOT: STRENGTHS 💪
• Brand Power: Two-wheeler leader in India 🥇
• Subsidiary Growth: Credit arm expansion, per data 📊
• Dividend: Steady payouts attract income fans 🔧
Got horsepower to spare! 🏍️
(7/9) – SWOT: WEAKNESSES & OPPORTUNITIES ⚖️
• Weaknesses: Below peak, macro risks 📉
• Opportunities: Two-wheeler demand, financing growth 📈
Can it accelerate or hit a bump? 🤔
(8/9) – POLL TIME! 📢
BAJAJAUTO at ₹7,711.25—your take? 🗳️
• Bullish: ₹9,000+ soon, growth kicks in 🐂
• Neutral: Steady, risks balance out ⚖️
• Bearish: ₹7,000 looms, market stalls 🐻
Chime in below! 👇
(9/9) – FINAL TAKEAWAY 🎯
BAJAJAUTO’s ₹7,711.25 price reflects confidence 📈, but volatility’s in the air 🌿. Dips are our DCA fuel 💰—buy low, ride high! Gem or bust?

Bajaj_Auto towards 5500Bajaj Auto has Head & Shoulder pattern breakdown.
This will lead it to 5500 with following targets;
7000 / 6500 / 6000 / 5500

#BAJAJAUTO DEMAND ZONEIn trading, a demand zone is an area on a price chart where buying interest is significantly strong, causing the price to bounce upward. It is the opposite of a supply zone, where selling pressure is dominant. Traders often use demand zones to identify potential entry points for buying, as the price is expected to rise from these levels.

BAJAJ AUTO LTD SWING TRADE SETUP📊 Price Action & Trend Analysis
Analyzing market trends using price action, key support/resistance levels, and candlestick patterns to identify high-probability trade setups.
Always follow the trend and manage risk wisely!
Price Action Analysis Interprets Market Movements Using Patterns And Trends On Price Charts.
👉👉👉Follow us for Live Market Views/Trades/Analysis/News Updates.

BAjaj Auto 7500 Bajaj Auto Ltd. is one of India's leading manufacturers of motorcycles, scooters, and three-wheelers. Established in 1945, the company has grown into a global brand known for its innovation, durability, and affordability. Bajaj Auto is renowned for models like the Pulsar, Dominar, and Platina in the motorcycle segment, as well as its popular three-wheelers used for public transport. With a strong presence in over 70 countries, Bajaj has positioned itself as the world's largest manufacturer of three-wheelers and one of the top motorcycle exporters from India. The company continues to focus on technological advancements, electric mobility, and sustainable transportation, reinforcing its reputation as a pioneer in the automotive industry.


BAJAJ AUTO | SHORT | INTRADAYBAJAJ AUTO is correcting from the Highs.
Lower Highs formation noticed. We can anticipate a correction further to 8675 price levels which should be a good support.
An intraday trade is certainly setting up my that logic.


Follow The Trend or Wait for Retracement...NSE:BAJAJ_AUTO trade at 10500. Support is at 9700 and Resistance at 10600.
P/E RATIO - 36.35 Industry P/E - 23.75
On the 23rd AUG Bajaj Auto give a Breakout above 10000 level. You can wait for Retracement otherwise Follow the Trend for Next Resistance at 11200-11500.

BAJAJ AUTO Shortterm VIEW BEARISHAfter a good run from Rs.4,000 (in APRIL 2023) Stock has doubled and more to Rs.10,000.
Along the journey We have seen small consolidations at Rs.8,500-9,300 and stock reached Rs.10k After that we have seen a small dip towards 8,800.
Now its forming a HNS Pattern in Weekly TF.
I expect a Downside correction to 7,000-7,300 Zone.
I also believe Automobile Sector will go through some consolidation.

BAJAJ AUTO --- excellent support for longsI see BAJAJ Auto has been at crucial support and forming nice bullish candles.
It has lot of potential to cross 10k. Actually this stock is running on discount price now for buyers..
THIS IS NOT SELL OR BUY RECOMMENDATION. I AM NOT SEBI REGISTERED
This is for learning purpose only.

BAJAJ AUTO LTD S/RSupport and Resistance Levels:
Support Levels: These are price points (green line/shade) where a downward trend may be halted due to a concentration of buying interest. Imagine them as a safety net where buyers step in, preventing further decline.
Resistance Levels: Conversely, resistance levels (red line/shade) are where upward trends might stall due to increased selling interest. They act like a ceiling where sellers come in to push prices down.
Breakouts:
Bullish Breakout: When the price moves above resistance, it often indicates strong buying interest and the potential for a continued uptrend. Traders may view this as a signal to buy or hold.
Bearish Breakout: When the price falls below support, it can signal strong selling interest and the potential for a continued downtrend. Traders might see this as a cue to sell or avoid buying.
MA Ribbon (EMA 20, EMA 50, EMA 100, EMA 200) :
Above EMA: If the stock price is above the EMA, it suggests a potential uptrend or bullish momentum.
Below EMA: If the stock price is below the EMA, it indicates a potential downtrend or bearish momentum.
Trendline: A trendline is a straight line drawn on a chart to represent the general direction of a data point set.
Uptrend Line: Drawn by connecting the lows in an upward trend. Indicates that the price is moving higher over time. Acts as a support level, where prices tend to bounce upward.
Downtrend Line: Drawn by connecting the highs in a downward trend. Indicates that the price is moving lower over time. It acts as a resistance level, where prices tend to drop.
Disclaimer:
I am not a SEBI registered. The information provided here is for learning purposes only and should not be interpreted as financial advice. Consider the broader market context and consult with a qualified financial advisor before making investment decisions.

Bajaj Auto | Shorted Again | SwingBajaj Auto has once again demonstrated further weakness by breaking the present days low and the crucial neck line.
Price is below all three crucial pivots - monthly, weekly & daily.
I have shorted it once more for the next target as 8760.

Bajaj Auto: Poised for a God Candle!Bajaj Auto is currently showing signs of forming a descending triangle, a pattern that typically signals a potential breakout. The big question is: Which way will it go?
Key Levels to Watch:
1️⃣ Support Zone: If the price breaks below the support, we could see a swift move downward. 📉
2️⃣ Resistance Zone: A breakout above the resistance might ignite a God Candle and send the stock flying. 🚀
Sentiment Check:
Bullish Case: Buyers take control, leading to a sharp upward rally.
Bearish Case: Sellers dominate, causing a breakdown to lower levels.
What’s your take? Are you betting on the bulls 🐂 or the bears 🐻? Share your thoughts! 💬
