BAJAJ AUTO swing tradeHello,
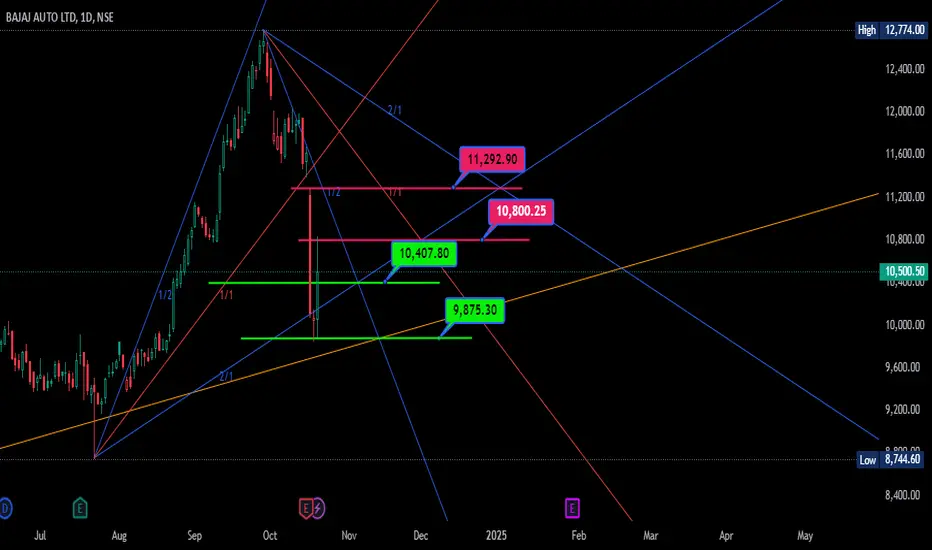
Trend-Based Analysis. Buy the Dips, Sell The Rallies, Also Following the Trend. Let's see where the Price Action takes us, Riding the wave. Potential trade setups based on trend momentum.
Technical analysis based on trend identification and momentum, Looking for high-probability setups within the prevailing trend.
Analyzing the current market trend and potential future price movement. Focusing on risk management and reward-to-risk ratios.
Details is Mentioned in Chart, Read carefully.. .
BAJAJ_AUTO trade ideas

🇮🇳"Long BAJAJ AUTO?!? Now? Are you crazy?" NOPE.Since I started using my FPC exit strategy, I have actually started to like down trends just a little. And this one is special.
BAJAJ_AUTO has been a stellar performer for almost 2 years, up over 200% in that time. But it has lost over 25% of its market cap just since Sept. 27th. Trading that with a long position seems like a death wish, doesn't it? Well, friends, sometimes things are not what they seem.
First of all, over the last 12 months, this stock has produced over 20 buy signals and every single one would have been profitable. Not just profitable - PROFITABLE. The average trade was +1.33% and lasted just 3 days. That's an annualized return of 111%.
"Yes", you say, "but that's because it was in a strong uptrend most of the year. It isn't any more. It's dropping like a rock." That's a fair point. Uptrending stocks are generally easy pickings for long trades and staying away from downtrending stocks is an excellent general rule.
But allow me this counterpoint. Since Sept. 27, the beginning of this plummet downward in the stock, my system would have generated 9 trades. All 9 were wins, averaged 1.98% and lasted an average of 2 days. That's right, the trades during the slump were actually MORE profitable than the trades from the rest of the year. In fact, they helped make that average I mentioned earlier higher than it would have been. The trades in the last 2 months produced gains that if annualized, work out to almost 250%. If I could, I would buy it if it went under 9421 at any point in the next trading session.
Per my usual strategy, once I'm in I'll add at the close on any day it is still oversold and I will use FPC (first profitable close) to exit any lot on the day it closes at any profit.
As always - this is intended as "edutainment" and my perspective on what I am or would be doing, not a recommendation for you to buy or sell. Act accordingly and invest at your own risk. DYOR and only make investments that make good financial sense for you in your current situation.

buy bajaj auto for swing
BUY BAJAJ AUTO FOR SWING TRADING APPROCHING MAJOR SUPPORT LEVEL CAN BE GOOD LEVELS TO GO LONG WITH 9200 SL ON CLOSING BASIS

Bajaj AutoBajaj Auto is a 12,000 future value stock. currently trading around 9500 levels
Right entry is 9350 levels and can add in every dip
Short Term Stop Loss - 9000 levels
Target levels
Short Term - 10,045
Long Term Targets - 10,463 / 11,129 / 11,809
This idea is just for education purpose and analysis and not for real time trading
kindly consult your financial adviser before investing

Bajaj Auto Weekly Long This level is in the middle of the big candle & a good candidate to go long. It is below the Daily DZ but that isnt a good level hence may act as trap as well.

BAJAJAUTO LONG 15mins Price bounced from this level in uptrend. It could give a quick 1.5:1 or 2:1. Combined both levels LOTL

Buy Bajaj Auto Short Term Trading Advice by Goodluck Capital
Buy Bajaj Auto
Buy Range- 9400 - 9600
Target- 10200 - 10400
StopLoss- below 9000
Potential Return- 7-9%
Approx trade duration 14 - 15 days

Long base breakout: Bajaj_AutoAfter 3 months of consolidation, bajaj auto broke out from a long base, horizontal line.

BAJAJ AUTO LTD S/RSupport and Resistance Levels: In technical analysis, support and resistance levels are significant price levels where buying or selling interest tends to be strong. They are identified based on previous price levels where the price has shown a tendency to reverse or find support.
Support levels are represented by the green line and green shade, indicating areas where buying interest may emerge to prevent further price decline.
Resistance levels are represented by the red line and red shade, indicating areas where selling pressure may arise to prevent further price increases. Traders often consider these levels as potential buying or selling opportunities.
Breakouts: Breakouts occur when the price convincingly moves above a resistance level (red shade) or below a support level (green shade). A bullish breakout above resistance suggests the potential for further price increases, while a bearish breakout below support suggests the potential for further price declines. Traders pay attention to these breakout signals as they may indicate the start of a new trend or significant price movement.
20 EMA: The yellow line denotes 20 EMA, to interpret the 20 EMA, you need to compare it with the prevailing stock price. If the stock price is below the 20 EMA, it signals a possible downtrend. But if the stock price is above the 20 EMA, it signals a possible uptrend.
Disclosure: I am not SEBI registered. The information provided here is for learning purposes only and should not be interpreted as financial advice. It is important to consult with a qualified financial advisor before making any investment decisions. Tweets neither advice nor endorsement.

BAJAJ AUTOFresh break out in bajaj auto. also it has all time high. can buy right now with sl. also gud entry on retest. with proper sl. target will be high. if it makes consolidation here.

BAJAJ AUTO LTD S/R for 16/7/24Support and Resistance Levels: In technical analysis, support and resistance levels are significant price levels where buying or selling interest tends to be strong. They are identified based on previous price levels where the price has shown a tendency to reverse or find support.
Support levels are represented by the green line and green shade, indicating areas where buying interest may emerge to prevent further price decline.
Resistance levels are represented by the red line and red shade, indicating areas where selling pressure may arise to prevent further price increases. Traders often consider these levels as potential buying or selling opportunities.
Breakouts: Breakouts occur when the price convincingly moves above a resistance level (red shade) or below a support level (green shade). A bullish breakout above resistance suggests the potential for further price increases, while a bearish breakout below support suggests the potential for further price declines. Traders pay attention to these breakout signals as they may indicate the start of a new trend or significant price movement.
20 EMA: The yellow line denotes 20 EMA, to interpret the 20 EMA, you need to compare it with the prevailing stock price. If the stock price is below the 20 EMA, it signals a possible downtrend. But if the stock price is above the 20 EMA, it signals a possible uptrend.
Disclosure: I am not SEBI registered. The information provided here is for learning purposes only and should not be interpreted as financial advice. It is important to consult with a qualified financial advisor before making any investment decisions. Tweets neither advice nor endorsement.

Bajaj auto ltdUptrend with HH HL
Breakout retest
Presence of demand at those levels
Rsi hidden bullish divergence and Avwap breakout

Bajaj Auto Going to upside for 10,000Bajaj Auto Going to upside for 10,000 minimum if sustain Above 9275 Invalid 8400 cmp. 9043

BAJAJ AUTO - SuperchargedNow its time for Bajaj Auto, looking good at this stage, i would love to go long now because everything is positive now like RSI above 60, trading above 60SMA and most important thing general election is over in India so now the way is clear !

BAJAJ AUTO LTD - NSE (BAJAJ-AUTO) ForecastThe stock chart for BAJAJ AUTO LTD - NSE (BAJAJ-AUTO) reveals interesting patterns and potential trading strategies:
1. Symmetrical Triangle Pattern:
- The chart displays a symmetrical triangle formed by converging trend lines.
- This pattern suggests a continuation of the existing trend.
- Traders should wait for a breakout from this triangle before making any moves.
2. Trading Strategies:
- Long Position:
- Consider buying if the price moves above a certain level.
- Target price for a long position: 3900.
- Short Position:
- Sell short if the price falls below a specific level.
- Target price for a short position: 3500.
3. Current Price:
- BAJAJ AUTO LTD is currently trading at 8948.20.
Remember, this analysis is based on technical patterns, and actual market behavior may vary. Always use additional indicators and risk management techniques when trading stocks.


Bajaj auto swing to positional trade Bajaj auto might give another break out with a good swing to positional trade opportunity
Entry - 9000
STOPLOSS - 8900
TARGETS - 9285, 9350, 9500++
Note- if any trade or value that's gone from the marked levels then that's not our trade just let it go or wait for it to come back
I'm not sebi registered this is my personal view


BAJAJ AUTOBelow are some support and resistance levels for BAJAJ AUTO stock. Currently, it is moving within a range.


Is Bajaj Auto Going to crash ?Bajaj Auto is At All Time High !!
Stock is in a Rising Channel and Prices are around the resistance
Resistance level is around 8500-8600
Previously we can observe that prices showed correction around 40% from the Resistance of the Channel
So can we expect the same fall ??
Lets see !!
WE ARE ATLEAST NOT BULLISH AT THIS TIME !!
