Auto sector bulling natureThe Nifty Auto Index has been the top-performing index this week, with Bajaj Auto showing consistent performance. The stock was consolidating in the range of 2900-4000 before breaking the crucial resistance level around 4000. After that, the stock skyrocketed and reached 8500. It still looks like a lucrative investment option for the medium-term horizon as the industry is performing well and the stock price is increasing with sufficient volume. Anyone can consider buying this stock for a medium-term investment.
Also can buy 8400 CE @ 176.05 with strong SL according to risk reward.
BAJAJ_AUTO trade ideas

Bajaj Auto Bearish BreakoutBajaj Auto may see a downside as per technical analysis, and the stock may show targets of 8245 in very short term.

Bajaj Auto might move further Bajaj auto can give a possible up move with a decent stoploss and good Targets
Entry - above or sustaining between
7715-7730
STOPLOSS - 7660
TARGETS - 7830, 7900, 8000-8030++
Note- if any trade or value that's gone from the marked levels then that's not our trade just let it go or wait for it to come back
I'm not sebi registered this is my personal view

BAJAJAUTO will reach 7000 ? cmp 6258Bajaj Auto broke 52 week high and showing momentum.
Technically bullish cmp 6258
Target as 6354, 6507, 6702
Reversal Support 5966 - 6090
6.70% Upside Potential

Bajai Auto.....Option trade ahead!?Hello Traders,
today I`d like to share the chart of "Bajaj Auot Ltd"., an Indian stock, that has risen since 08/23 in an impulsive move!
What caught my eye, is the fact, that the stock broke out to new highs on Friday, after a consolidation in a rectangle above 7419!
If this brekout is succesful, the stock should advance to multiple new high`s in the coming days and weeks.
Keep in mind, that a new ATH always is a new "buy-signal"!
This opens the door to sell a "Short-put" at tomorrows opening, and you will take the premium at first!
The next interesting fact is, the opportunity to set a close "stop-loss" @ 7210 or at the lower boundary of the rectangle @7032.15!
Choose a expiry date (max at 6-10 days) and a price "in the money"! Check before if any financial news to follow in the coming days for this stock! If so, let the option end before the news!
Let my know your thoughts about this trading-idea!
I am always thankful for comments, critics and new ideas!
Have a great week.....
Ruebennase
Please ask or comment as needed.
Trading based on this analysis is at your own risk.

Update on $NSE:BAJAJ_AUTODear Followers,
I hope this message finds you well. I wanted to provide you with a brief update on the stock NSE:BAJAJ_AUTO I have been monitoring.
It appears that the stock is approaching a potential resistance level Near 7150-7180 This is an important technical point where the price has historically had difficulty breaking through. It suggests that we may see a temporary halt in the current upward momentum and Possibly it will test 10050 In Downmove.
Resistance Levels to Watch out.
Resistance levels are the opposite, representing prices at which a stock has historically struggled to move above. These levels can signal a selling interest. Understanding resistance points is crucial for anticipating potential obstacles in the upward movement of a stock.
R1= 7150
R2= 7230
R3= 7350
Support Levels To Watchout.
Support levels represent prices at which a stock has historically had difficulty falling below. These levels often indicate a strong buying interest. It's important to monitor these levels, as a breach might suggest a potential downward trend.
S1= 7030
S2= 6810
S3= 6680
As always, please remember that investing involves risks, and it's important to carefully consider your options. If you have any questions or would like to discuss this further, please don't hesitate to reach out.
Best regards,

Bajaj Auto 1 hour Chart AanalsisBajaj auto is about to give a breakout on 1 hr chart
wait for breakout above @7059
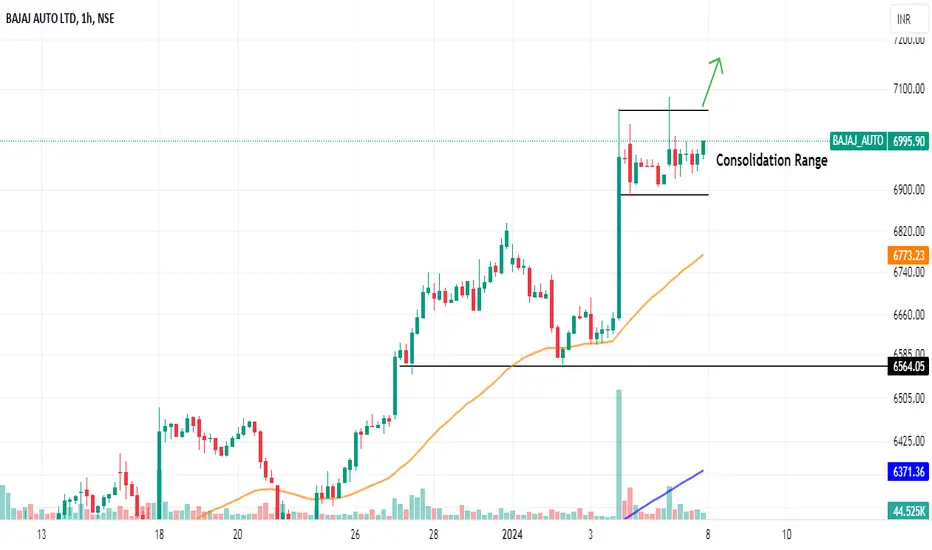
bajaj auto for intradaybajaj auto on bigger time frame is in up trend and today is has give a good consolidation and in daily time frame it has made a inside candle so for tomorrow if it break 7040 level we can trade for the target of 7100 and second target will be 7200 .

BAJAJ AUTO Support & Resistance for 1/1/24Support and Resistance Levels:
Based on the price action, you have to identify two significant levels: the red line acting as resistance and the green line acting as support. Additionally, there have marked red and green shades to represent resistance and support zones, respectively.
Support: The green line and green shade represent support levels. These levels are where the price tends to find buying interest, preventing it from falling further. Traders can consider these levels as potential buying opportunities.
Resistance: The red line and red shade represent resistance levels. These levels are where the price tends to encounter selling pressure, preventing it from rising further. Traders can consider these levels as potential selling opportunities.
Breakouts: If the price breaks above the resistance zone (red shade) convincingly, it may indicate a bullish breakout, and the price could move higher to the next resistance level. On the other hand, if the price breaks below the support zone (green shade) convincingly, it may indicate a bearish breakout, and the price could move lower to the next support level.
Keltner Channel:
The Keltner Channel is a technical indicator that uses an exponential moving average (EMA) to create an upper and lower channel around the price action. Traders can use this channel to identify potential long and short positions.
Long Position: If the price is above the upper line of the Keltner Channel, it may indicate a potential long opportunity, as it suggests the price is trading above the average range and might continue in an upward trend.
Short Position: If the price is below the lower line of the Keltner Channel, it may indicate a potential short opportunity, as it suggests the price is trading below the average range and might continue in a downward trend.
Disclosure: I am not SEBI registered. I just wanted to let you know that the information provided here is for learning purposes only. Please consult your financial advisor before making any decisions. Tweets neither advice nor endorsement.


BAJAJ_AUTO for LongsBAJAJ_AUTO for Longs
Taking Trend Line support
Entry above 3625, it can touch in short term 3772 / 3921 / 4100

Bajaj-Auto Simple Price Action Analysis BullishNSE:BAJAJ_AUTO is in an Up-Trend and it is continuously creating Higher Highs and Higher Lows on the Candlestick Chart.
As there is no Trend Change signal, hence the expectation is that it will continue its Up-Trend by creating a new Higher Low in this Chart.
Price can test the Trendline and the last Resistance before going up.
So, we should think of Buying this Stock at every Dip and holding it till 5599. This will give a Return on Investment between 20% to 29% in just a few days.

Bajaj auto bearish viewThis is my personal viewpoint and I can be wrong but still I thought about sharing my view publicly. I won’t be responsible for any investment decisions.

Trendline Breakout - BAJAJAUTOPlease look into the chart for a detailed understanding.
Consider these for short-term & swing trades with 2% profit.
For BTST trades consider booking
target for 1% - 2%
For long-term trades look out for resistance drawn above closing.
Please consider these ideas for educational purpose
Please note that, if there are some big targets, those are drawn thinking for long term.

Possibilities of bajaj autoNSE:BAJAJ_AUTO Finally stock break resistance of trendline and goes to bullish territory, retracement of trendline also completed, now stock ready to upmove. If stock give closing on daily timeframe basis below trendline, take stoplossl and exit.

BAJAJAUTO
NSE:BAJAJ_AUTO
One Can Enter Now ! Or Wait for Retest of the Trendline (BO) Or wait For better R:R ratio
Note :
1.One Can Go long with a Strict SL below the Trendline or Swing Low of Daily Candle.
2. Close, should be good and Clean.
3. R:R ratio should be 1 :2 minimum
4. Plan as per your RISK appetite
Disclaimer : You are responsible for your Profits and loss, Shared for Educational purpose

Bajaj auto started profit booking On Our Harmonic pattern indicator based trade setup take trade as explained below :-
Early trades Buy or sell below/ above 23.6 %, safe trades buy or sell above / below 41% , after taking trade next upside or downside levels will be target ,
When reverse buy or sell signal appear then book profit on Target or trail SL to 23.6 % If trailing SL hit then early trade can be taken above or below 23.6 and safe trade can b taken above/ below 41% ..
Please note:-
It's working on news based and volitile market very well so exit if SL hit

Buy BAJAJ AUTO Ltd @ CMP with T 7200 and SL 4420NSE:BAJAJ_AUTO
Previously the stock had a break out in weekly chart. Though its a late buy, the stock shows a bullish sign in weekly chart. The indicators, RSI, PSAR and volume shows a incremental sign. We have a target around 7200 with a margin of 40% in 6 months to one year.
Its a good stock to put it in basket.

bajaj autobajaj auto is at a great breakout after the retest it would go great numbers .volume of breakout is good . risk reward ratio is also good

Bajaj Auto: A Bullish Odyssey Unfolds!Are you ready for a potential game-changer in your investment portfolio? Bajaj Auto (BAJAJ_AUTO) is currently displaying some compelling signs of a bullish trend that you won't want to miss.
Technical Analysis:
Candlestick Patterns: The 9-day chart for Bajaj Auto is adorned with the colours of optimism – blue candle and and green background . These bullish candles suggest that the stock is currently on an upward trajectory.
Multiple Timeframes: To solidify this bullish outlook, we've analysed multiple timeframes, including 2D, 6D, 7D, 8D, 9D, and 22D charts. The consistent presence of bullish signals across these timeframes signifies a strong and sustained upward movement.
Fundamental Analysis:
Company Overview: Bajaj Auto is a prominent player in the Indian automotive industry, known for its robust product lineup and strong market presence.
Financial Stability: Assess the company's financial health, analyzing factors such as revenue growth, profitability, and debt levels.
Industry Trends: Consider the broader industry trends, such as the demand for two-wheelers and the company's competitive positioning.
Recent News: Stay updated with any recent news or developments related to Bajaj Auto that could impact its stock performance.
Key Insights:
Volume Confirmation: A crucial aspect of this bullish outlook is the confirmation by trading volume. Ensure that the surge in stock prices is supported by substantial trading volume, indicating genuine market interest.
Risk Management: Always set stop-loss levels to protect your investment in case the trend reverses.
Diversify: While Bajaj Auto may present a strong opportunity, diversifying your portfolio is essential to manage risk effectively.
In conclusion, Bajaj Auto is showing all the signs of a promising bullish trend, supported by technical and fundamental analysis. However, remember that all investments come with inherent risks, so make informed decisions and consider consulting a financial advisor if needed. Keep a close eye on this stock and be prepared to seize the opportunity as it unfolds. 📈🚀

BAJAJ AUTO rising megaphone On the chart we can see a rising megaphone formation.
The price is still moving inside the pattern. Our strategy is to enter short at the upsloping resistance line.
The target would be at the upsloping support.
Invalidation of the thesis could be if the price closes above the upsloping resistance.

BAJAJAUTONSE:BAJAJ_AUTO
One Can Enter Now ! Or Wait for Retest of the Trendline (BO) Or wait For better R:R ratio
Note :
1.One Can Go long with a Strict SL below the Trendline or Swing Low of Daily Candle.
2. Close, should be good and Clean.
3. R:R ratio should be 1 :2 minimum
4. Plan as per your RISK appetite
Disclaimer : You are responsible for your Profits and loss, Shared for Educational purpose

BAJAJ AUTOIT IS
At all time high can buy on retracement. near 4380 can best buy . will have gud risk reward ratio.
