BAJFINANCE - BO BUY SETUPBullish on this scrip. Expecting it to break ATM.
This was in range from past one year.
Buy is recommended once it crosses 8000 price level
BAJFINANCE trade ideas


Bajaj finance give 400 points upside now Ready for 8250-8300For all trade on my Auto Harmonic patterns indicator trade setup -
Risky trades can take trade after crossing 23.6% on either side and safe traders can take trade after 41% We can start buying when our Trailing SL hit at 23.6% with SL of recent low our Target will be 41%, 78.6% , 127.2% 161.8% and 223.6 % , when reversal pattern appears on chart we have to trail our SL if trailing SL hit exit from long trade and initiate sell trade ,

BAJAJ FINANCE SELL SETUPThere is liquidity at the higher trendline so once that liquidity is taken we shall short.
Have a nice day 💰💰💰

Bajaj finance ready for 8000 again For all trade on my Auto Harmonic patterns indicator trade setup -
Risky trades can take trade after crossing 23.6% on either side and safe traders can take trade after 41% We can start buying when our Trailing SL hit at 23.6% with SL of recent low our Target will be 41%, 78.6% , 127.2% 161.8% and 223.6 % , when reversal pattern appears on chart we have to trail our SL if trailing SL hit exit from long trade and initiate sell trade ,

BAJAJFINANCE rejecting an important level multiple timesBAJAJ FINANCE has been rejecting the 7441.00 level multiple times in 5 min and 15 mins timeframe.
Go long once price crosses 7460 level.
Targets can be marked via pivot point.
Happy Trading :)

❤️ with trend line and wedgeBajaj finance formed a perfect inverted cup with handle
Once wedge broke on down side make 💰💰💰


Bajaj FInance ReversalBajaj Finance reversed. I applied a simple strategy by connecting previous highs to estimate a low or reversal point. As seen here, Bajaj Finance reversed from the same low, which acted as support.

$BAJFINANCE 7R trade ideaNSE:BAJFINANCE in 4h is creating liquidity to grab a nice trade to the upside with 7R.
what do you think of the trade idea?

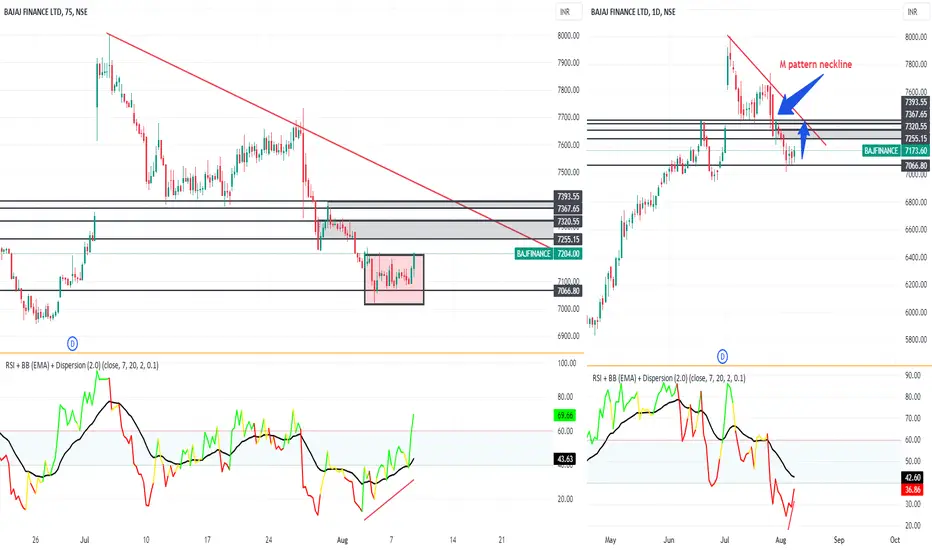
Baja Finance Intraday Trade Levels and AnalysisThe stock is reversing from demand zone after 4 days of consolidation in the same zone, also there is a double top breakdown in Daily time frame, and the stock is poised for a retest of the Double Top neckline area.
75 minutes shows Double bottom very evident with RSI divergence and RSI moving into 70+ strength zone, an up move of odd 7200-7400 levels is possible.
Hence with the above levels, one can consider a long Intraday trade with an RR of min 1:1 or max even 1:2.
BAJFINANCE : Expecting a sell-offValuation of this stock is high and also the financials are also not that attractive even if price reaches the low of the channel or wedge mentioned.
But still if price reaches the low of the channel then a position can be taken if the overall market sentiment favours a bullish move and confidence, at that time. Also the fundamentals of the company at that time should also be considered.

Bajaj Finance Bajaj finance is a fundamental strong and biggest NBFC of India and currently company showed its Q1 FY23 result. So we can take it as a trader and investor also. If stock slip blow its 50day EMA than we should add this amazing one into our portfolio.

Bajaj Finance to hit 8000Bajaj Finance if it breaks above 7200 and then 7800 and sustains a big move is expected to come to move it's price to 8000. Let's wait for the move.

Bajaj Finance - for 20% returnHi All, Levels and Targets are mentioned on the chart. Wait for the breakout and close of candle to enter.
For educational purpose only.

BAJFINANCE 30MIN CHART BAJFINANCE 30MIN CHART
Breakout @ 7660 Target 8380 Support 7540
BAJFINANCE has witnessed a trend line breakout along with resistance break on 30min chart & is ready for some action.
Its only an observation & not any suggestion.

Bajaj Finance Long Bajaj Finance short term positional trade
First target 8000 Second target 8300
Consolidation and Retracement at 0.38 Fibo level.
2 - 3 weeks duration

BAJAJ FINANNCE INRTRADAY SETUP FOR TOMMOROWhas been trading in range for 5 days after small correction buy above 7526 after retest with a sl of 7495 tgt 7615

#BAJAJFINANCE long trade idea setupGreetings Folks,
today i have prepared a setup on bajaj finance nse
the setup is simple as it looks
we are targeting the ssl as a fuel for our trade
ONLY enter if u expect volatility
dont enter right away when it reaches our zone
first let the price make some structure in lower timeframe that should be bullish ofc
dont play with fire use pre defined stoploss always

Bajaj Finance - Short Target 5700Stock is making triangle as part of cycle wave correction. Though will not achieve its desired target down, expected to fall to 5700 in about 47 days (CMP 7027, -18.8% fall).
Swing traders will make it find support at 6536, which could be weak as that level was shortlived. Swing traders may also target 50% retracement of the current wave down to 6321 (-10% fall).
If this wave becomes wave 2 of primary movement upwards, then it should fall to 6138 (-13% fall) following 61.8% retracement rule of wave 1.
This current wave, demostrated all the powerful properties of wave C, and terminated with a perfectly making ending diagonal, making it an aptly fit candidate for the horizontal triangle, being the base theory.
Turbulence areas - 5800 levels being a demand zone.
I am targeting short to 5700 levels in about 47 days.
Disclaimer :
The views hereinabove are my personal views, for the sole objective of seeking comments from community on the analysis. Notwithstanding above, it should not be construed as any guidance, advice or offer to enter into any transaction or investment by the reader. The readers must consult their independent financial advisors before initiating or otherwise dealing with the security mentioned herein, without relying on the contents herein. The author shall not be responsible or liable, whether directly or indirectly, for any losses, pecuniary or otherwise, arising from the use of above analysis or information, whether to the reader hereof or any third party.

bajaj finbajaj fin. consolidating ,, if it break the resis. a long move can be expect ,, keep in checklist

BAJFINANCEBajfinance Chart Analysis.........17/07/23
Bajfinance Long above - 7525 Lvl.
Sl - 7430,
Target - 7620 / 7640 / 7680
Enjoy !
