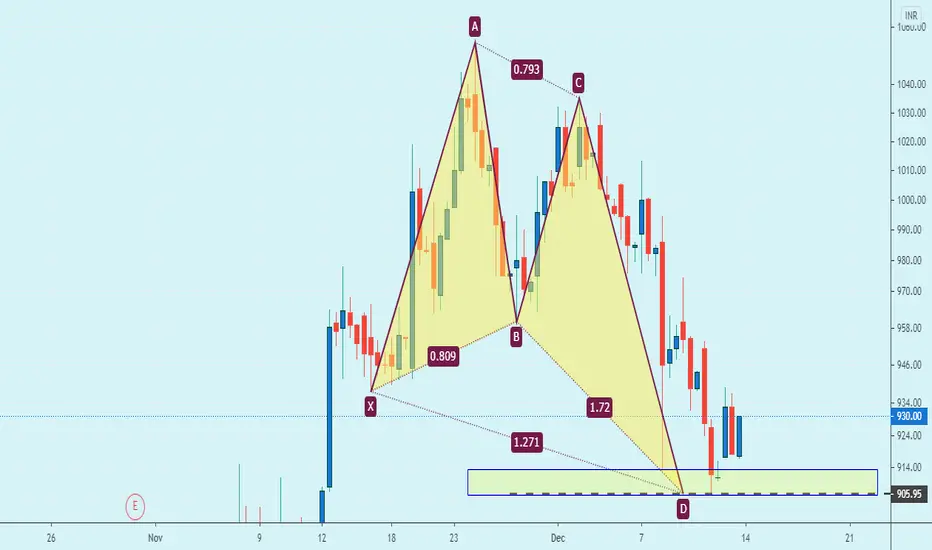
Balaji Amines swing trading analysis. Balaji Amines swing trading analysis.
Today, the stock has made an attempt
to move above this selling zone.
But see how the selling pressure
came into existence.
See the upper wick is so high than
it's the body. It is clearly indicating
the supply is still there and should be absorbed.
This is a strong supply zone and
as stock entered into this zone ppl are selling.
A huge volume is needed
to breach this selling zone.
BALAMINES trade ideas

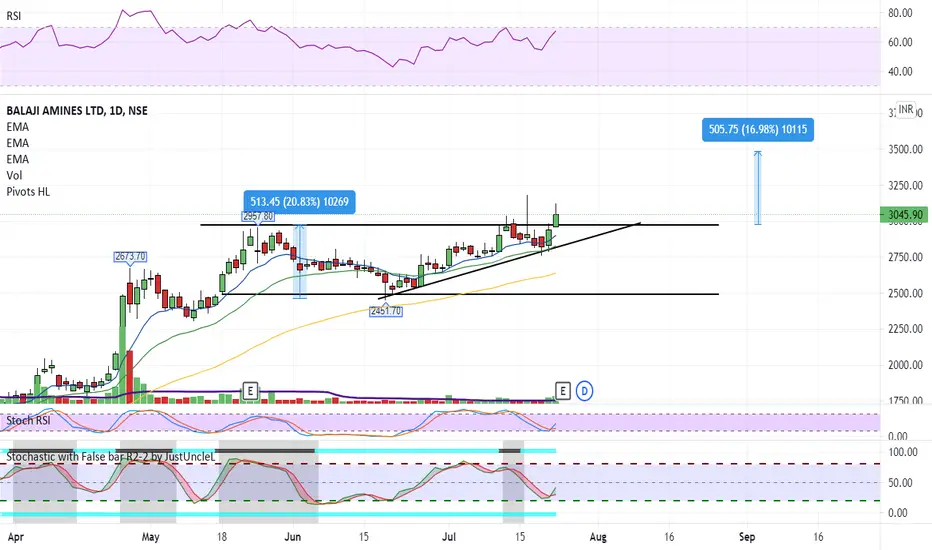
Bullish pattern in BALAMINESPeanut formation with 50 & 20 EMA crossover..
RSI also taking great support on 60 level.Can be a great buy for Swing trade after breakout of the comsolidation.

BALAMINE LONG TERM1. Its in Accumulation phase .
2. Over the last 5 years, revenue has grown at a yearly rate of 15.32%, vs industry avg of 3.49%
3.Over the last 5 years, net income has grown at a yearly rate of 32.82%, vs industry avg of 10.86%
4, Strong Financials :-
3 year CAGR growth
Revenue 14.9%
NetProfit 28.1%
OperatingProfit 25.3%
5.34.72% away from 52 week high , Nice correction has given opportunity to accumulate at these levels
6.FII/FPI have increased holdings from 2.35% to 4.0% in Sep 2021 qtr.
7.Institutional Investors have increased holdings from 2.65% to 4.49% in Sep 2021 qtr.
8.1 Month: Delivery volume fell by -42.05%
9.1 Day: Delivery volume increased by 386.08% over 5 day average

risky trade buy or sellcmp; 3409
buy above 3500
sell 3000
H&S pattern on 1D tf
Disclaimer:
All information shared is just for educational purposes.
By no means shall we be accountable for any debits/losses amounting out of it.
We are not SEBI registered Analysts, so please consult your Investment Advisor and take rational decisions.

Picture perfect patternTriple Bottom Pattern in Balaji Amines. Confirmation and trend reversal above 3350.

BALAJI AMINES LTD (LONG)Good volume coming in this Stock
It took support at 200 EMA
BUY near 3000
SL 2700
Tgt's 3500 - 4018 - 4256 - 4450 - 4990
Please Correlate by yourself also on charts. This is for Educational and Paper Trading Purpose Only. Must Consult your financial advisor before Investing.

BALAMINES LONG TRADE1. Bounce back from support zone.
2. Bounce back from 200 SMA
3. Short term trend line breakout
CMP : 3279
T1: 3889
T2: 4375
SL: 2885

BALAJI AMINES LTDMust Correlateyourself on charts before taking an entry. This is for Educational purposes only. Please consult your Financial advisor before investing.

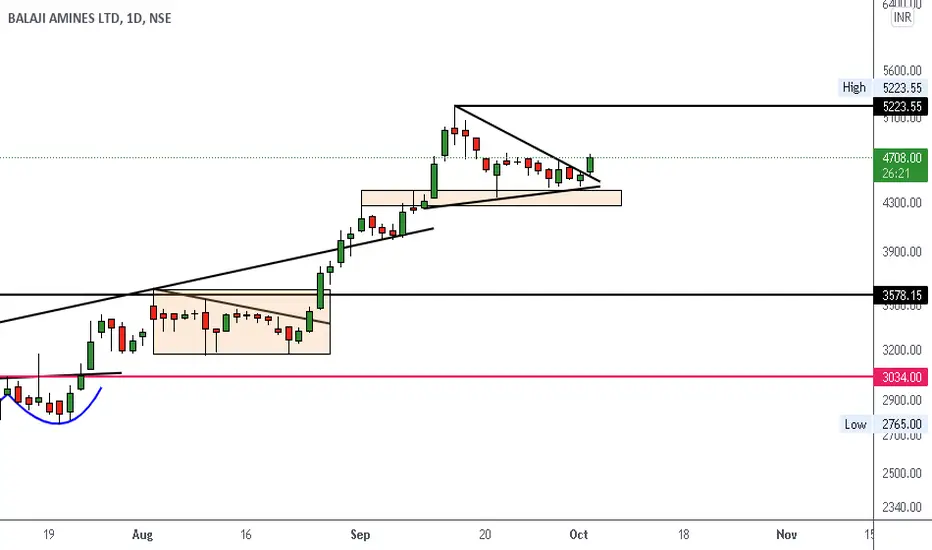


BALAMINES - Triangle BreakoutBuy above 3120
Target 3500 being height of triangle
Volume coupled with breakout

LONG - BALAJI AMINESBuy: 2675 1st lot - confirmation on RSI & RS required for more conviction
AWAP: 2595
SL: 2518
Early Exit: RS < 50 EMA / RSI < 50
Value:
- Price under VCP & taking support @ RS 50 EMA
- Price above VWAP and Supply Zone
- RSI above 50 level
Trigger:
- Narrow Rang Breakout with bullish bar
- Enhanced Volume
- Deliveries: Daily deliveries are higher than 10 moving average
- RSI & RS Reversal is confirmed
2nd lot confirmation
- Break out above 2750 (VCP)
- Follow-through


Balaji Amines - PreResult RallyIf Balaji goes above 2650 it could go to 2830 before its results on 24th May.
SL below 2600.
This is a short term intraday kind of play so plan it accordingly.


How I Captured A 100% Move In BalaminesFirst Thing You Need to Know Here Is That All The Strategies in the world are only successful if you can exercise the patience required. Sitting Tight Is the most important skill not reading charts.
I Went Long In Balamines on 26th October 2020 Basis A Weekly Inside Bar Breakout. The Stock Was In A Strong Uptrend Before This And Had Taken A Pause Between August to October. The Movements Became Tighter & Smaller with each passing week and that is when it started showing up on my radar. I took my first long when the high of 19th October candlestick was breached, The Stock did nothing for a week post my buy ( sitting tight is important through these phases ), Exploded Post this and reached a high on 1054 in November but reversed from there again. It was waiting time again, I waited for a month and the movements started becoming tighter again in the week starting on 28th December, I went long again when the high of this candle was breached at 950. The stock flew next week making a monster move of 22% in one week. After another month of waiting in Feb came another monster move of 35% in one week. By First Week Of March the stock reached a price of 1905, A 114% Move over my average price.
I am Still Holding the stock. The Moves Came Coz I sat through the dull phases not because I have a special skill in reading charts.
Hope This Helps You in improving your performance. Always Trade On A predefined risk.