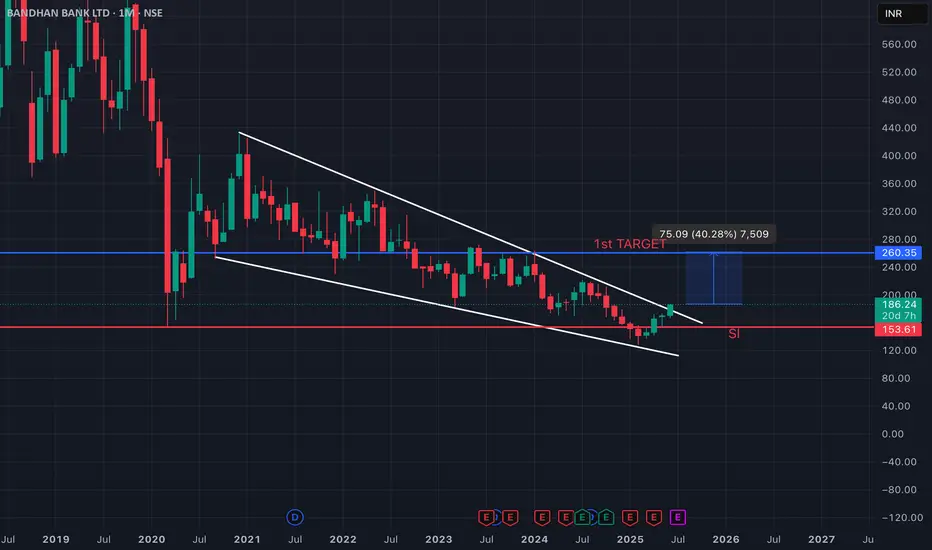
BANDHANBANKNSE:BANDHANBNK
Note :
1. One should go long with a Stop Loss, below the Trendline or the Previous Swing Low.
2. Risk :Reward ratio should be minimum 1:2.
3. Plan your trade as per the Money Management and Risk Appetite.
Disclaimer :
>You are responsible for your profits and loss.
>The idea shared here is purely for Educational purpose.
>Follow back, for more ideas and their notifications on your email.
>Support and Like incase the idea works for you.
BANDHANBNK trade ideas

Bhandan Bank - Long - Support @ 20/50 DEMABhandan Bank - Long:
- Price takes support at 20/50 DEMA
- Today good price movement with decent volume
- Earnings in 2 days
- Hidden bullish divergence
- First time price takes support at 50/20 DEMA after Golden Crossover
- Good candidate for Intraday tomorrow when prices
are favorable in lower timeframe

Bandhan Bank - first major trend reversal! Upside to ₹215–230Thesis:
Bandhan Bank has broken out above the ₹185 zone after constructing a multi-month rounded base between ₹130 and ₹185. This marks the first major structural reversal after a multi-year downtrend. The breakout is backed by above-average volume and positive momentum.
Technical Structure:
Breakout Level: ₹180
Current Price: ₹189.64
Volume Surge: 11.4M (above 20-day average)
RSI (14): 67.5 — trending strong, near breakout zone
Targets:
₹215 ( 13.8% upside ) — measured move of near-term range
₹259 ( 25% upside ) — major horizontal resistance from 2022
Disclaimer:
Not a recommendation. For educational use only. Position already held from earlier. This post reflects personal strategy execution in a structured portfolio.


BANDHAN BANK BREAKOUTHi guys,
I hope you all are enjoying my charts and levels.
After a long consolidation the stock has given a breakout from its descending channel. Makes a great entry point for long
Sl - 150 WCB(weekly closing basis)
Target - 20% +
Will update...
Plz leave a like and do follow

Trying to get back to in uptrend?Bandhan Bank, after a long gap, it may try to cross this trend line Watch!

Is right time to invest in Bandhan bank?yes, asper my analaysis through technical fib, bandhan bank done a double bottom and support at deep suppport and target of ATH

BANDHAN BANK on weekly chart form a Cup & Handle patternBandhan bank Forming Cup & Handle pattern ,Breakout of this pattern will be above 210 level ,Stoploss will arround 190 & Target will be arround 250 ...Accumulation can be done from current level ,But actual movement will start after crossing 210 level

BANDHAN BANK LONG SETUPTechnical Analysis
Chart Observations:
Price: Closed at ₹151.53
Candle: Strong green candle, breaking recent resistance
Volume: Healthy volume (approx. 4.92M) — confirms price action
RSI: 61.59 — bullish but not yet overbought, still room to go
Structure : Ascending structure since early Feb 2025 — higher highs and higher lows forming.
Key Levels
Immediate Resistance L: ₹153.50–₹155 Watch for breakout confirmation
Major Resistance : ₹163–₹165 Gap area and previous breakdown zone
Support : ₹147–₹148.5 Last consolidation area
Strong Support : ₹141.50–₹143 Higher low and volume cluster
Trade Setup:
1. Breakout Play
Entry: ₹153.60+ (on strong candle & volume)
SL: ₹147.90
Target 1: ₹158
Target 2: ₹163+
2. Pullback Entry
Entry Zone: ₹147.50–₹149
SL: ₹144.50
Target: ₹153 first, trail after
Additional Chart Insights:
RSI is in bull zone (above 60) — shows growing momentum
Structure resembles an inverse head & shoulders in formation — bullish reversal pattern
Volume spikes seen on bullish days — demand is active

Bandhan Bank In Demand ZoneBandhan Bank entering a demand zone suggests a potential reversal or bounce, but confirmation is crucial before making a trade.
How to Analyze Bandhan Bank's Demand Zone?
✅ 1. Identify the Demand Zone
Look for previous strong support levels where price has bounced multiple times.
Check if institutional buying is visible through large-volume candles.
✅ 2. Compare with Nifty 50 & Bank Nifty

Yeh Bandhan to, pyaar ka Bandhan hai....Naheeee.....This stock has been on a downward spiral since the big bang.....It lost its last level of support and struggling there....Either this will be reduced to a penny stock, or we can expect a reversal....Unless govt does something to revive the sentiments in the stock market, many stocks will be revisiting their lows.....many will break their lows, crores will be wiped out....and when the last bull becomes a bear, thats when markets will reverse....Fundamentally, the bank is still making money, balance is sheet is ok, if not exceptional....I have bought positions with multiple sells till its lifetime high....will start selling in increments of 5 and crossing 10% profit like 10%, 15%, 20%....etc....

Bandhan bank's long tradeIts hourly as well as daily structure looks good for a long position
Trade with RR

BANDHAN BANK Bandhan bank trading in crucial zone . need to retest again the prz zone than it will fly ...

Bandhan bank 160.00 RS double Bottom formedHello frds ,
we can small investment in this bank from Current price level
investment view for 2 year ,
very low risk , because its demand zone.
its Corona 2020 level .

a significant fundamental devolopmentNSE:BANDHANBNK there has been a devolpment which should bring a change in attitude towards bandhan bank as an investment in my sense kindly read below
Sub.: Grant of stock options under Bandhan Bank Employee Stock Option Plan Series 1
(‘ESOP Series 1’)
Pursuant to the applicable provisions of the SEBI (Listing Obligations and Disclosure
Requirements) Regulations, 2015 (‘SEBI LODR’), this is to inform that the Board of Directors
of Bandhan Bank Limited (‘Bank’), at its meeting held on December 24, 2024, granted
2,96,353 equity stock options of the face value of Rs. 10 each (‘ESOPs’), at the grant price of
Rs. 164.38 (Rupees One Hundred Sixty Four and Thirty Eight Paisa only) per option to Mr.
Ratan Kumar Kesh, Executive Director & Chief Operating Officer (‘ED&COO’) of the Bank
when the esop has been granted at current market price my observation are as stated below
Granting ESOPs at the Current Market Price:
The exercise price of ₹164.38 matches the stock's closing price on December 23, 2024. This means employees will not receive the options at a discount. They can only profit if the share price increases above this level in the future.
This practice indicates confidence in future growth but does not offer immediate financial advantage to the recipient unless the stock appreciates.
Incentive for Performance:
Employees are motivated to focus on long-term goals that drive the stock price upward.
Since the options are granted at the market price, there’s no immediate gain; the payoff is tied to delivering meaningful results over time.
Alignment with Shareholders:
Leaders now have a vested interest in improving the company’s financial performance, as their personal gains are directly linked to shareholder returns.
No Immediate Dilution:
Since the ESOP is priced at the market value, it avoids concerns about significant undervaluation that could lead to larger dilution upon exercise.
Bandhan Bank shows confidence in its market valuation, signaling to investors that it believes the stock price will appreciate.
Shareholder dilution is minimal since the ESOP is priced at the prevailing market rate, meaning no intrinsic value exists at the time of the grant.
Granting ESOPs at the current market price is a strategic move that ties leadership rewards to future performance without offering upfront monetary benefits. It aligns executive incentives with shareholder interests and signals confidence in the bank’s growth trajectory, though its impact will be realized only over the long term.

Bandhan bank can hit 220Bandhan bank at sweat spot to take risk
buy cmp 159 target 220
Long term target 1200

Bandhan Bank- Keep in WatchlistBandhan Bank is a small private listed bank in India. It provides loans in microfinance sector.
It has been in a long term downward trend. It has a lifetime high of 740. It has been in news for all reasons, both good and bad.
You can see a longterm resistance trend line. It needs to break this to show some real upmove towards its life high.
This a high beta stock, not for weak hearts.
Keep a watch and take positions if it crosses long downward trendline.
This is not a buy/sell recommendation.
This post is only for educational purpose.
Kindly consult your financial advisor before investing.
Keep strict stoploss and money management rules.
Happy Trading!!

BANDHAN BANK LTD S/RSupport and Resistance Levels:
Support Levels: These are price points (green line/shade) where a downward trend may be halted due to a concentration of buying interest. Imagine them as a safety net where buyers step in, preventing further decline.
Resistance Levels: Conversely, resistance levels (red line/shade) are where upward trends might stall due to increased selling interest. They act like a ceiling where sellers come in to push prices down.
Breakouts:
Bullish Breakout: When the price moves above resistance, it often indicates strong buying interest and the potential for a continued uptrend. Traders may view this as a signal to buy or hold.
Bearish Breakout: When the price falls below support, it can signal strong selling interest and the potential for a continued downtrend. Traders might see this as a cue to sell or avoid buying.
20 EMA (Exponential Moving Average):
Above 20 EMA(50 EMA): If the stock price is above the 20 EMA, it suggests a potential uptrend or bullish momentum.
Below 20 EMA: If the stock price is below the 20 EMA, it indicates a potential downtrend or bearish momentum.
Trendline: A trendline is a straight line drawn on a chart to represent the general direction of a data point set.
Uptrend Line: Drawn by connecting the lows in an upward trend. Indicates that the price is moving higher over time. Acts as a support level, where prices tend to bounce upward.
Downtrend Line: Drawn by connecting the highs in a downward trend. Indicates that the price is moving lower over time. It acts as a resistance level, where prices tend to drop.
RSI: RSI readings greater than the 70 level are overbought territory, and RSI readings lower than the 30 level are considered oversold territory.
Combining RSI with Support and Resistance:
Support Level: This is a price level where a stock tends to find buying interest, preventing it from falling further. If RSI is showing an oversold condition (below 30) and the price is near or at a strong support level, it could be a good buy signal.
Resistance Level: This is a price level where a stock tends to find selling interest, preventing it from rising further. If RSI is showing an overbought condition (above 70) and the price is near or at a strong resistance level, it could be a signal to sell or short the asset.
Disclaimer:
I am not a SEBI registered. The information provided here is for learning purposes only and should not be interpreted as financial advice. Consider the broader market context and consult with a qualified financial advisor before making investment decisions.

Diwali gift for all Ready for reversal trend1. Wait for a Clear Breakout
Entry Condition: A strong monthly close above the descending channel, ideally near or above the first target level of 272 INR. This would indicate that the long-term downtrend might be breaking, showing potential for a reversal.
Volume Confirmation: Look for increased volume to confirm buying interest. A breakout with strong volume typically indicates institutional participation, which could drive prices higher.
Target Zones: If a breakout occurs, you could aim for Targets 2 and 3 on the chart (428 and 742 INR, respectively) as mid- to long-term targets.
2. Support-Based Entry with a Stop-Loss
Entry Condition: If the price reaches the lower support area around 153-164 INR and shows signs of consolidation or buying interest (such as bullish candlesticks or volume spikes), it could be an opportunity to buy at a discount.
Stop-Loss: Set a stop-loss just below the support, around 150 INR or slightly lower, to manage risk in case the stock continues to fall.
Profit Targets: You could aim for Target 1 (272 INR) initially, then reassess if it continues upward.
3. Gradual Accumulation (DCA Approach)
Entry Condition: If you believe in the company’s long-term potential but the technicals are still unclear, you could consider dollar-cost averaging (DCA) over time. This approach reduces the risk of buying all at once and allows you to take advantage of lower prices if the stock declines further.
Accumulation Zones: Consider accumulating in the 150-180 INR range, as it offers potential support and a relatively lower-risk entry zone.
Exit Plan: Re-evaluate when it reaches key resistance levels, especially around the 272 INR level, to decide if you want to continue holding or book partial profits.
4. Look for Bullish Reversal Signals
Entry Condition: Watch for reversal patterns like a bullish engulfing candle, double bottom, or RSI divergence around the support area. These signals could indicate a potential upward move.
Volume and Momentum Indicators: Pay attention to indicators like MACD or RSI on the weekly/monthly chart for bullish crossovers, suggesting that momentum could be shifting in favour of buyers.
Important Considerations
Market Sentiment: Given the overall downtrend, be mindful of broader market conditions, especially for the banking sector.
Fundamental Check: Combine this technical approach with a look at Bandhan Bank's recent financial performance, management commentary, and sector trends, as these factors can affect price movement significantly.
Risk Management: Set stop-loss orders and be disciplined about adhering to them to protect your capital, especially in a volatile or uncertain market.
This approach is purely technical, so it's wise to balance it with a thorough understanding of the company's fundamentals and any recent news that might impact its long-term performance.

BANDHANBNK Multi-Year BreakdownBANDHAN BANK is within falling triangle pattern, expecting to do multi-year breakdown in Weekly timeframe


Bandhan Bank - Magic Waiting to Happen !!Magic Waiting to Happen: Bandhan Bank's Weekly Chart Overview
- The downtrend line since 2020 has been a key resistance level.
- ₹250 and ₹200 have served as a consolidating range's upper and lower boundaries.
- You can now access our structured charts for all Nifty 500 companies . Check the signature column below for more info.
- Recent base formation suggests accumulation, supported by a surge in volume.
- The stock has gained momentum following the RBI's nod for a change in MD, CEO.
Bandhan Bank is currently coiling up for what looks like a significant breakout. With the downtrend line as the final hurdle and volume picking up, the chart suggests that magic is waiting to happen. A break above the resistance zones could trigger a bullish trend reversal, so it's worth keeping a close watch on this stock in the coming weeks.
DISCLAIMER: The information provided here is for educational purposes only and does not constitute financial advice or a recommendation to buy, sell, or hold any security. Stock market investments carry risk, and you should consult with a qualified financial advisor before making any trading decisions. Past performance is not indicative of future results.
