BANK NIFTY-15MHere are the levels for Bank nifty to trade for tomorrow intraday and mark these levels on the chart.
Draw fib retracement from swing high to low. The moment of the price will decided where the price is gonna open. If the price open flat or gap down then it trap the sellers and move up as there are multiple support levels below, 0.618 fib level and structural support level and Day low as well.
Here I mention only the high probability trades only. as intraday trader you can have multiple entries and exits according to your setups.
DISCLAIMER: This is my own analysis and you do your own analysis before you take any trade and I am not SEBI registered and contact your financial adviser before taking any trades .I am not responsible for your profit or loss. This is only for educational purpose and learning.
comment below if you have any doubts.
BANKNIFTY trade ideas

Bank Nifty Weekly Analysis: Key Levels & Trend OutlookWeekly Recap:
Bank Nifty opened last week with a gap-down at 49,336.10, plunging 2,166.6 points or -4.21%. However, it recovered over the course of the week and eventually settled at 51,002.35, registering a modest weekly decline of -0.97%.
Key Weekly Levels for Next Week
Price Action Pivot Zone:
The crucial range to watch for potential reversals or trend continuation is 50,860 to 51,115
Support & Resistance Levels:
Support Levels:
S1: 50,487
S2: 50,103
S3: 59,650
Resistance Levels:
R1: 51,560
R2: 52,011
R3: 52,577
Market Outlook:
Bullish Scenario: If Bank Nifty sustains above 51,115, it could see buying interest, potentially pushing towards R1 at 51,560 and higher levels.
Bearish Scenario: A breakdown below 50,860 could trigger further downside pressure, targeting S1 at 50,487 and lower support levels.
Disclaimer: lnkd.in

BANKNIFTY 51400 NEXTBANKNIFTY 51400 NEXT
Bank Nifty has been experiencing some volatility lately. Based on technical indicators, the index is currently showing strong sell signals. Moving averages and oscillators suggest a bearish trend, with several indicators pointing towards selling pressure

BANKNIFTY WEEK AHEAD - ( APRIL 3RD WEEK )Nifty Bank is looking positive on charts. If BankNifty manages to cross and sustain above 51200, then we can expect upside to continue up to levels of 51976-52280. If due to any news factor, BankNifty breaches the 51000 level, then it can fall upto the level of 50200 to even 49825.
All levels are marked in the chart posted!!

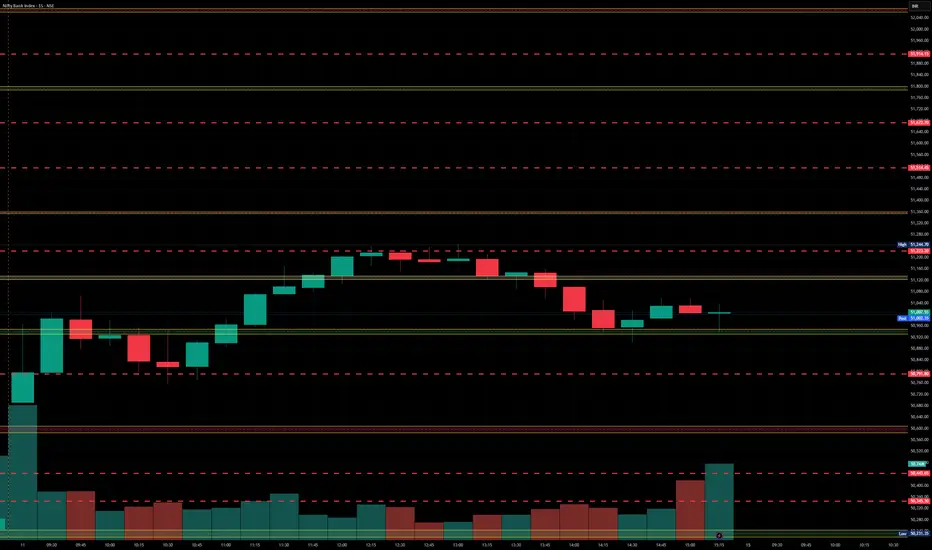
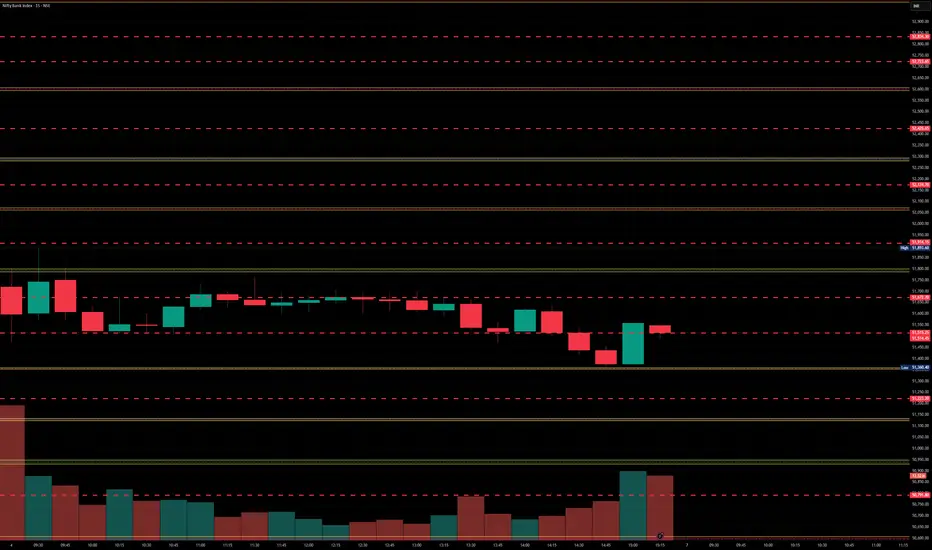
BankNifty levels - Apr 15, 2025Utilizing the support and resistance levels of BankNifty, along with the 5-minute timeframe candlesticks and VWAP, can enhance the precision of trade entries and exits on or near these levels. It is crucial to recognize that these levels are not static, and they undergo alterations as market dynamics evolve.
The dashed lines on the chart indicate the reaction levels, serving as additional points of significance. Furthermore, take note of the response at the levels of the High, Low, and Close values from the day prior.
We trust that this information proves valuable to you.
* If you found the idea appealing, kindly tap the Boost icon located below the chart. We encourage you to share your thoughts and comments regarding it.
Wishing you successful trading endeavors!
[INTRADAY] #BANKNIFTY PE & CE Levels(11/04/2025)Today will be strong gap up opening expected in banknifty. Expected opening above 51000 level. If banknifty starts trading and sustain above 51050 level then expected further upside rally upto 51450+ level and this can be extends for further 400-500+ points if gives breakout of 51550 level. Below 50950 level expected downside movement in index upto 50550 support level.

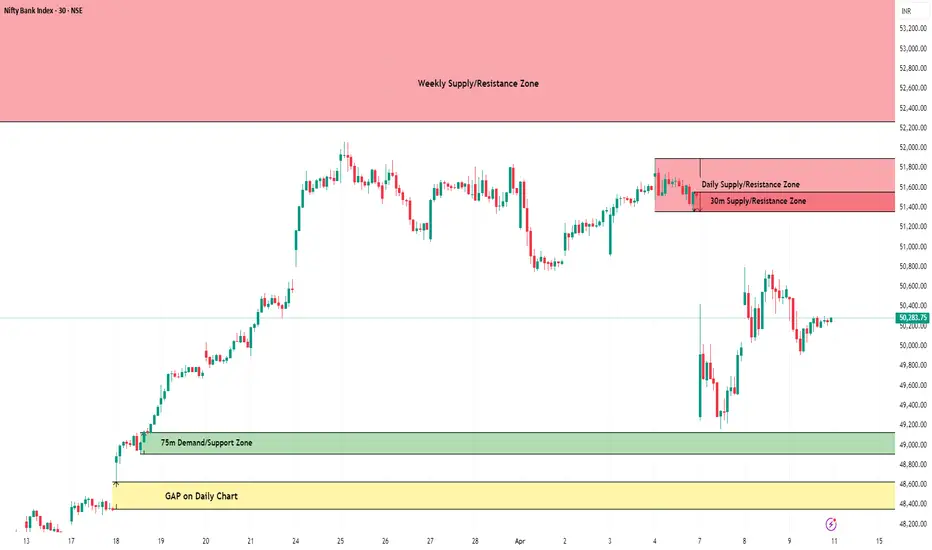
BankNifty Intraday Support & Resistance Levels for 11.04.2025🔄 Quick Recap since the last update (21.03.2025):
BankNifty rallied to a high of 52,063.95 on 25th March, piercing through the earlier mentioned Weekly Supply Zone by 84 points. But the bullish momentum was short-lived. Following Trump’s tariff announcement, BankNifty plunged sharply, dropping over 2,800 points to hit a low of 49,156.95 on 7th April.
🌍 Global sentiment has been shaken, but signs of recovery are emerging. Dow Futures have rebounded 4,000 points (10%), currently trading around 40,700 — a hopeful sign, but volatility remains elevated.
📅 On Wednesday (09.04.2025):
BankNifty opened with a gap-down, hit high of 50,496.90, and made a low at 49,910.85 before settling at 50,240.15, down 271 points for the day.
🔹 Trend Analysis:
Weekly Trend (50 SMA): Sideways
Daily Trend (50 SMA): Sideways
📉 Demand/Support Zones
Near Demand/Support (75m): 49,215.95 – 49,698.05
Gap Support (Daily Chart): 48,354.15 – 48,629.45
Far Support: 47,700 – 47,850 (multiple time tested on Daily Chart)
Major Support: 46,077.85 (Low of 4th June 2024)
Far Demand/Support (Daily): 44,633.85 – 45,750.40
📈 Supply/Resistance Zones
Near Supply (30m): 51,360.40 – 51,559.20 (Inside Daily Supply)
Near Supply (Daily): 51,360.40 – 51,893.60
Far Supply (Weekly): 52,264.55 – 53,775.10
🔍 Outlook:
With both trends turning sideways, BankNifty remains in a consolidation phase. Bulls are currently trapped under a strong resistance zone starting from 51,360, while downside support begins near 49,200.
Considering the volatile global setup, we may see a range-bound move with sharp intraday swings. The index must cross 51,900 decisively for any further upside. Until then, sell-on-rise near supply and buy-on-dip at demand continues to be the approach. Stay cautious. Trade levels, not emotions.
📢 Disclaimer: This analysis is intended for educational purposes only. It is not investment advice. Please consult your financial advisor before making any trading decisions.
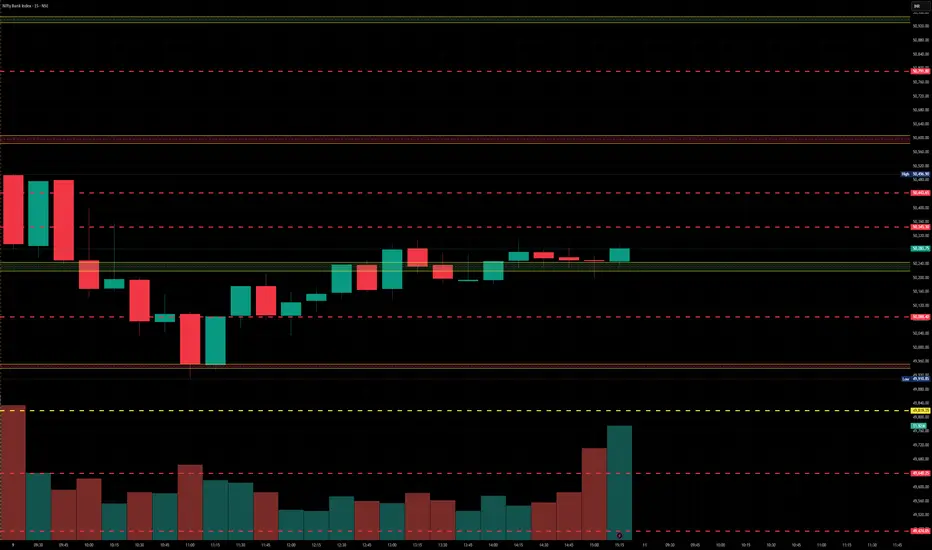
BankNifty levels - Apr 11, 2025Utilizing the support and resistance levels of BankNifty, along with the 5-minute timeframe candlesticks and VWAP, can enhance the precision of trade entries and exits on or near these levels. It is crucial to recognize that these levels are not static, and they undergo alterations as market dynamics evolve.
The dashed lines on the chart indicate the reaction levels, serving as additional points of significance. Furthermore, take note of the response at the levels of the High, Low, and Close values from the day prior.
We trust that this information proves valuable to you.
* If you found the idea appealing, kindly tap the Boost icon located below the chart. We encourage you to share your thoughts and comments regarding it.
Wishing you successful trading endeavors!
bn on 15 min tf long positionHere i have marked the order block near the fvg that is valid and price is uptrend in htf(1hr)
Looking for price to enter fvg and reverse.
or hit both fvg and ob with wick and hit the target that is the recent high in 15min

[INTRADAY] #BANKNIFTY PE & CE Levels(09/04/2025)Today will be flat opening expected in index. After opening if banknifty sustain above 50550 level then expected upside movement upto 50950 in today's session. Major downside expected if banknifty starts trading below 50450 level. This downside rally can goes upto 50050 support level. 50000-50050 is the important support for index. Any Strong downside only expected below this support zone.

BANKNIFTYNSE:BANKNIFTY
CURRENTLY DOESNT LOOK GOOD TO INVEST,
LONG TERM TRENDLINE BROKEN.
ONE SHOULD WAIT FOR FURTHER SUPPORT ON WEEKLY BASIS.
LOOKS TOUGH SHORT TERM AND MID TERM !!!!!!!
Note :
1. One should go long with a Stop Loss, below the Trendline or the Previous Swing Low.
2. Risk :Reward ratio should be minimum 1:2.
3. Plan your trade as per the Money Mangement and Risk Appetite.
Disclamier : You are responsible for your profits and loss.
The idea shared here is purely for Educational purpose.
Follow back, for more ideas and their notifications on your email.
Support and Like incase the idea works for you.

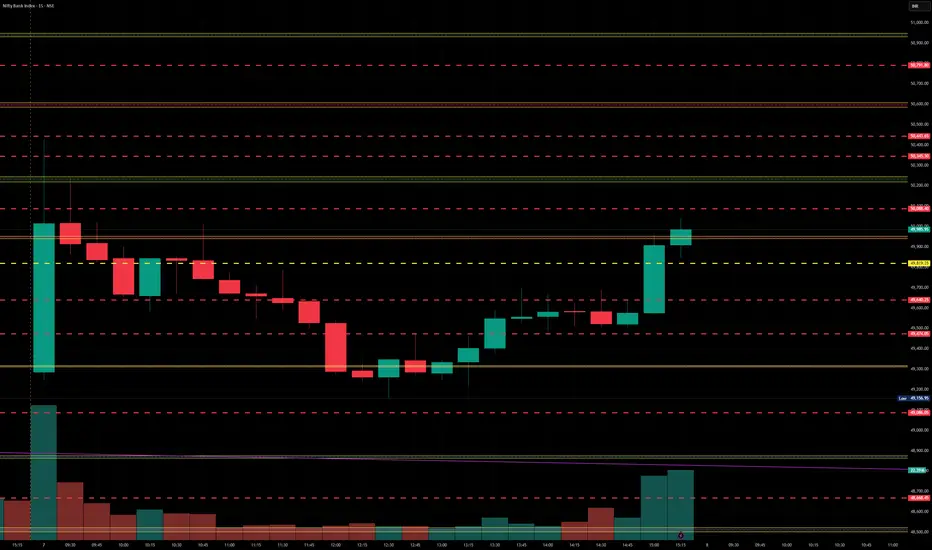
BankNifty levels - Apr 09, 2025Utilizing the support and resistance levels of BankNifty, along with the 5-minute timeframe candlesticks and VWAP, can enhance the precision of trade entries and exits on or near these levels. It is crucial to recognize that these levels are not static, and they undergo alterations as market dynamics evolve.
The dashed lines on the chart indicate the reaction levels, serving as additional points of significance. Furthermore, take note of the response at the levels of the High, Low, and Close values from the day prior.
We trust that this information proves valuable to you.
* If you found the idea appealing, kindly tap the Boost icon located below the chart. We encourage you to share your thoughts and comments regarding it.
Wishing you successful trading endeavors!

[INTRADAY] #BANKNIFTY PE & CE Levels(08/04/2025)Today will be gap up opening expected in banknifty near 50500 level. After opening if banknifty starts trading above 50550 level then expected upside rally upto 50950 level in today's session. 50950 will act as a strong resistance. Bullish movement can reversal from this level. In case banknifty starts trading below 50450 then possible further sharp downside rally upto 50050 and this can extend upto 49550 level if index gives breakdown of 50000 level and starts trading below 49950.

BankNifty levels - Apr 08, 2025Utilizing the support and resistance levels of BankNifty, along with the 5-minute timeframe candlesticks and VWAP, can enhance the precision of trade entries and exits on or near these levels. It is crucial to recognize that these levels are not static, and they undergo alterations as market dynamics evolve.
The dashed lines on the chart indicate the reaction levels, serving as additional points of significance. Furthermore, take note of the response at the levels of the High, Low, and Close values from the day prior.
We trust that this information proves valuable to you.
* If you found the idea appealing, kindly tap the Boost icon located below the chart. We encourage you to share your thoughts and comments regarding it.
Wishing you successful trading endeavors!
Bank Nifty Weekly Analysis: Key Levels & Trend OutlookWeekly Recap:
The Bank Nifty closed the week at 51,502.7, posting a decline of -0.12%.
Key Weekly Levels for Next Week
Price Action Pivot Zone:
The crucial range to watch for potential reversals or trend continuation is 51,617 to 51,390
Support & Resistance Levels:
Support Levels:
S1: 51,051
S2: 50,599
S3: 50,149
Resistance Levels:
R1: 51,959
R2: 52,415
R3: 52,833
Market Outlook:
Bullish Scenario: If Bank Nifty sustains above 51,617, it could see buying interest, potentially pushing towards R1 at 51,959 and higher levels.
Bearish Scenario: A breakdown below 51,390 could trigger further downside pressure, targeting S1 at 51,051 and lower support levels.
Disclaimer: This analysis is for educational purposes only and does not constitute financial advice. Please conduct your own research or consult a financial advisor before making any trading decisions.

[INTRADAY] #BANKNIFTY PE & CE Levels(07/04/2025)Today will be huge gap down opening expected in banknifty near 1500+ points downside possible. Possible banknifty will open near 49750 level in today's session. After opening if any correction can reverse from 50450 level. Downside next support for banknifty is near 49550 level. If banknifty not hold this support level and starts trading below 49450 level then expected further selling and downside movement in index for 700-1000+ points upto the 48550 level.

BANKNIFTY APRIL 2ND WEEK ANALYSISBanknifty is looking positive, but as we have already discussed in the Nifty weekly analysis about global uncertainty ,we can expect Banknifty to form a low near 50540 . But if Banknifty breaches 50544, then we can witness a new range to open , which I have specially marked below . There are 3 levels to watch in Banknifty if it breaks below 50544:
1.) 50028
2.) 49392
3.) 48922
But if Banknifty manages to secure 50544, then we can expect a green weekly closing in Banknifty.

BankNifty levels - Apr 07, 2025Utilizing the support and resistance levels of BankNifty, along with the 5-minute timeframe candlesticks and VWAP, can enhance the precision of trade entries and exits on or near these levels. It is crucial to recognize that these levels are not static, and they undergo alterations as market dynamics evolve.
The dashed lines on the chart indicate the reaction levels, serving as additional points of significance. Furthermore, take note of the response at the levels of the High, Low, and Close values from the day prior.
We trust that this information proves valuable to you.
* If you found the idea appealing, kindly tap the Boost icon located below the chart. We encourage you to share your thoughts and comments regarding it.
Wishing you successful trading endeavors!
[INTRADAY] #BANKNIFTY PE & CE Levels(04/04/2025)Today will be gap down opening in banknifty. After opening if banknifty starts trading below 51450 level then expected downside upto 51050 level. For today's session 51000 level will act as a strong support for banknifty. Any major downside only expected below 50950 level. Strong upside rally possible if index starts trading and sustain above 51550 level.

BankNifty levels - Apr 04, 2025Utilizing the support and resistance levels of BankNifty, along with the 5-minute timeframe candlesticks and VWAP, can enhance the precision of trade entries and exits on or near these levels. It is crucial to recognize that these levels are not static, and they undergo alterations as market dynamics evolve.
The dashed lines on the chart indicate the reaction levels, serving as additional points of significance. Furthermore, take note of the response at the levels of the High, Low, and Close values from the day prior.
We trust that this information proves valuable to you.
* If you found the idea appealing, kindly tap the Boost icon located below the chart. We encourage you to share your thoughts and comments regarding it.
Wishing you successful trading endeavors!

[INTRADAY] #BANKNIFTY PE & CE Levels(03/04/2025)Today will be gap down opening expected in index. Expected opening near 51000 level. After opening if banknifty sustain above 51050 level then possible upside movement upto 51450 in opening session. But in case banknifty starts trading below 50950 level then expected sharp downside movement upto 400-500+ points and this can extend further upto 50050 in case it gives breakdown of 50450 level.

bank nifty down 50000 or up 52500bank nifty down 50000 or up 52500
index that represents the performance of the banking sector in India. It includes the most liquid and large-cap banking stocks listed

BankNifty levels - Apr 03, 2025Utilizing the support and resistance levels of BankNifty, along with the 5-minute timeframe candlesticks and VWAP, can enhance the precision of trade entries and exits on or near these levels. It is crucial to recognize that these levels are not static, and they undergo alterations as market dynamics evolve.
The dashed lines on the chart indicate the reaction levels, serving as additional points of significance. Furthermore, take note of the response at the levels of the High, Low, and Close values from the day prior.
We trust that this information proves valuable to you.
* If you found the idea appealing, kindly tap the Boost icon located below the chart. We encourage you to share your thoughts and comments regarding it.
Wishing you successful trading endeavors!
