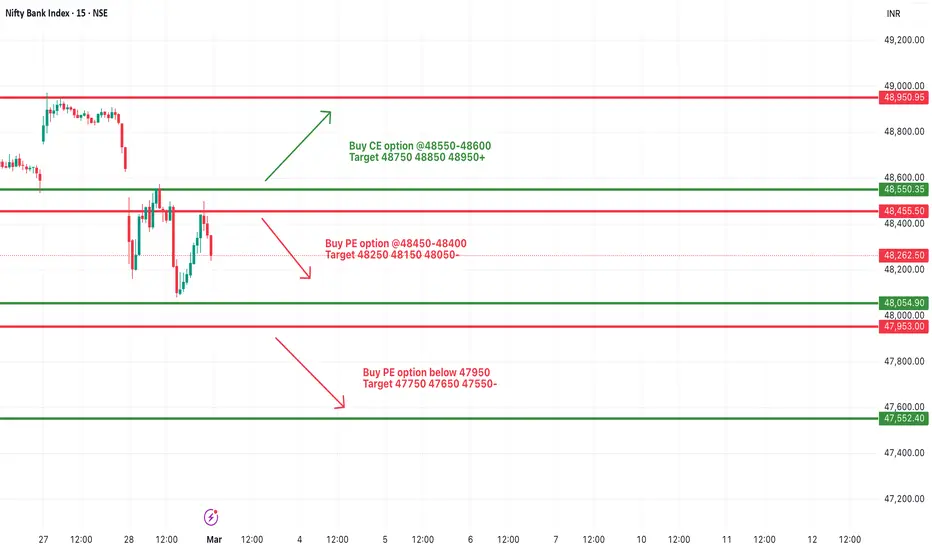
[INTRADAY] #BANKNIFTY PE & CE Levels(11/03/2025)Today will be slightly gap down opening expected in banknifty. After opening if it's sustain above 48050 and give reversal then possible some bullish rally in index. Upside 48450 level will act as a strong resistance for today's session. Any strong bullish side rally only expected above 48550 level. In case banknifty starts trading below 47950 level then there will be sharp downside rally possible in index upto 47550 level.
BANKNIFTY trade ideas

BANKNIFTY - Intraday Trading levels and Plan for 11-Mar-2025📅 BANK NIFTY TRADING PLAN – 11-Mar-2025
🕘 Time Frame: 15-Minutes | 📍 Strategy Type: Structure + Psychological Zones
📉 Yesterday Close: 48,168
📌 Gap Reference: Consider 200+ points as significant gap for tomorrow's session.
🔼 1. GAP-UP OPENING (Above 48,368+)
A gap-up above 48,368+ may place prices directly inside or near the Golden Retracement Zone (48,035–48,299) or even challenge the first resistance of 48,412 / 48,626.
🧠 Plan of Action:
If opening is around 48,400–48,500, wait for price action confirmation near 48,626, which is also last intraday resistance.
If you see a rejection candle or bearish engulfing pattern, this is an opportunity to go short with SL above 48,868.
Partial profit can be booked around 48,168–48,035 zone.
On strong breakout and hourly close above 48,868, one may consider riding long till 49,113 with strict SL below 48,626.
🎯 Short Trigger Zone: 48,600–48,800
📈 Long Trigger Zone (Breakout): Above 48,868 with volume
➖ 2. FLAT OPENING (±100 points near 48,168)
This is the most delicate opening as price will remain inside the Opening Resistance/Support Zone (48,035–48,299). Whipsaws are common here.
🧠 Plan of Action:
Avoid first 30 mins of trade to let price settle.
If Bank Nifty bounces from 48,035–48,100, and forms a bullish candle, consider it a low-risk long opportunity with SL below 48,000.
Upside target remains 48,412 / 48,626.
However, if price decisively breaks below 48,035, especially after 10:30 AM with volume, you may consider shorting with SL above 48,168 targeting 47,573 – 47,363.
🔎 Key Tip: Flat openings require patience. Wait for strong 15-min candle outside the support/resistance band before taking action.
🔽 3. GAP-DOWN OPENING (Below 47,968)
A gap-down below 47,968 indicates bearish control and may bring the price directly into the “Must Try Zone for Buyers” (47,573 – 47,363).
🧠 Plan of Action:
If price opens around 47,600–47,400, wait for a 15-min bullish reversal candle (like hammer, bullish engulfing).
You can consider a long position with SL below 47,363 (preferably on hourly close).
If buyers fail to protect this zone and price sustains below 47,363, this will trigger fresh downside — avoid catching falling knives and switch to short bias.
🎯 Buy Zone: 47,573 – 47,363 (Only on reversal pattern confirmation)
📉 Breakdown Zone: Below 47,363 with hourly candle
💡 Risk Management Tips for Options Traders:
Never buy options blindly on open – wait for direction clarity after the first 15-30 mins. Use spreads (Bull Call or Bear Put) near key zones to minimize premium decay. Place hard SL on premium or index level — whichever hits first. Avoid over-leveraging on gap-up/gap-down — IV crush can kill premiums even if direction is right. Book partial profits and trail stop-loss to reduce emotional decisions.
📌 Summary & Conclusion:
Watch 48,626 as a major resistance — rejection here may bring intraday weakness.
Key support lies at 48,035 and deeper at 47,573 – 47,363, which is a critical make-or-break zone.
Gap-up = Cautious short near resistance
Flat = Wait for structure to unfold
Gap-down = Reversal play or breakdown opportunity based on price reaction
Always let the price action confirm your bias and follow your plan with discipline.
⚠️ Disclaimer: I am not a SEBI-registered analyst. This analysis is shared for educational purposes only. Please consult your financial advisor before making any trading decisions.

[INTRADAY] #BANKNIFTY PE & CE Levels(10/03/2025)Today will be flat opening expected in index. It will open near 48500 level. After opening any bullish side rally only expected if banknifty starts trading and sustain above 48550 level. Strong downside movement possible if banknifty gives breakdown of 48450 zone. Downside 48050 level expected after the breakdown.

BANKNIFTY : Intraday Trading levels and Plan for 10-Mar-2025📌 Previous Close: 48,453
📍 No Trade Zone: 48,300 – 48,523
📈 Last Intraday Resistance: 48,944
📉 Last Intraday Support: 48,038
📌 Key Reversal Zone for Buyers: 47,363 – 47,573
📍 Scenario 1: Gap-Up Opening (🔼 +200 points or more)
If Bank Nifty opens around or above 48,650 – 48,700, we are entering the upper boundary of the last resistance zone, and the market may either show strength or immediately trigger profit booking.
Wait & Watch in Opening: Let the price stabilize in the first 15-30 minutes. If Bank Nifty sustains above 48,944, we could see a quick rally toward the upper profit booking zone 49,113 – 49,278.
Reversal Possibility: This is also a possible rejection zone. If Bank Nifty shows reversal signs near 48,944 – 49,113, traders can look for short trades with stop-loss above 49,278, targeting 48,650 and 48,523 as immediate supports.
Avoid Longs near Top Zone: Booking profits is advised rather than initiating fresh longs in this zone unless a very strong bullish candle closes above 49,278 on 15-minute time frame.
📢 Educational Insight: A gap-up into resistance often invites sellers. Don’t chase green candles blindly. Let structure confirm strength.
📍 Scenario 2: Flat Opening (±100 points range)
If Bank Nifty opens between 48,400 – 48,500, we are inside the “No Trade Zone.” This zone usually indicates indecision or lack of momentum in the early part of the session.
Wait for Breakout or Breakdown: No fresh trade unless price breaks 48,523 on the upside or 48,300 on the downside with good volume.
Above 48,523: A bullish breakout may trigger short-term buying with upside targets of 48,635 and then 48,944.
Below 48,300: A bearish breakdown opens room till 48,038 and possibly to 47,573, the “must try” zone for buyers.
📢 Educational Insight: The middle of the range is where retail traders often get trapped. Stay out until direction is clear. Trade the edges, not the middle.
📍 Scenario 3: Gap-Down Opening (🔽 -200 points or more)
If Bank Nifty opens near or below 48,200 – 48,100, bearish sentiment will dominate. Immediate support lies at 48,038. Below this, things could get even more interesting.
Reversal Zone Alert: Watch how price reacts near 48,038. A strong bullish reversal candle here could give a risk-reward favorable long trade toward 48,300 – 48,523.
Breakdown Below 48,038: Opens the gates for a larger fall towards 47,573 and even 47,363, where bulls might step in aggressively.
Aggressive Shorts: Only if price sustains below 48,038 with momentum, look for intraday puts or bear spreads.
For Reversal Buyers: Ideal zone for buying would be in the range of 47,363 – 47,573, only if price shows base formation with demand candle.
📢 Educational Insight: Don’t panic-buy a gap down unless strong reversal signs appear. Let sellers exhaust themselves before stepping in.
🛡️ Risk Management Tips for Options Traders
✅ Avoid Overleveraging – Never go all-in on the first trade. Use only a portion of your capital.
✅ Always Use Stop Loss – Especially if trading naked options. Protect your capital like a warrior.
✅ Time Decay Caution – Avoid holding long options too late in the day unless strong move is confirmed.
✅ Prefer Spreads – In volatile zones, go with defined-risk strategies like debit or credit spreads.
✅ Avoid First 15 Minutes – Let the market set a tone before jumping in. This reduces emotional entries.
📌 Summary & Conclusion
🟩 Above 48,944 → Bullish territory. Targets: 49,113 → 49,278
🟧 Between 48,300 – 48,523 → No Trade Zone. Wait for confirmation.
🟥 Below 48,038 → Bearish zone with potential downside to 47,573 → 47,363
✅ 47,363 – 47,573 is a high-probability reversal zone for buyers if tested.
⚠️ Be a disciplined trader – let the setup come to you. Stick to your plan, and manage risk like a pro. 💪
⚠️ Disclaimer
I am not a SEBI-registered analyst. This trading plan is shared for educational purposes only. Please do your own analysis or consult with a financial advisor before making any trading decisions.
📢 #BankNifty #TradingPlan #OptionsTrading #StockMarketIndia #TechnicalAnalysis #TradingView #PriceAction #NSE #BankNiftyLevels #RiskManagement

Banknifty March 2nd Week Analysis Banknifty can remain subdued throughout the week. I expect positive bias as long as Banknifty sustains above 47960. If it breaches 47960, then we can expect a slight negative move in Banknifty and it can drift to 47700 and below. The upside is expected only above 48908. If it successfully crosses and sustains above 48908, then we can expect momentum to continue up to 49740-50097.

BANK NIFTY S/R for 7/2/25Support and Resistance Levels:
Support Levels: These are price points (green line/shade) where a downward trend may be halted due to a concentration of buying interest. Imagine them as a safety net where buyers step in, preventing further decline.
Resistance Levels: Conversely, resistance levels (red line/shade) are where upward trends might stall due to increased selling interest. They act like a ceiling where sellers come in to push prices down.
Breakouts:
Bullish Breakout: When the price moves above resistance, it often indicates strong buying interest and the potential for a continued uptrend. Traders may view this as a signal to buy or hold.
Bearish Breakout: When the price falls below support, it can signal strong selling interest and the potential for a continued downtrend. Traders might see this as a cue to sell or avoid buying.
MA Ribbon (EMA 20, EMA 50, EMA 100, EMA 200) :
Above EMA: If the stock price is above the EMA, it suggests a potential uptrend or bullish momentum.
Below EMA: If the stock price is below the EMA, it indicates a potential downtrend or bearish momentum.
Trendline: A trendline is a straight line drawn on a chart to represent the general direction of a data point set.
Uptrend Line: Drawn by connecting the lows in an upward trend. Indicates that the price is moving higher over time. Acts as a support level, where prices tend to bounce upward.
Downtrend Line: Drawn by connecting the highs in a downward trend. Indicates that the price is moving lower over time. It acts as a resistance level, where prices tend to drop.
Disclaimer:
I am not a SEBI registered. The information provided here is for learning purposes only and should not be interpreted as financial advice. Consider the broader market context and consult with a qualified financial advisor before making investment decisions.

[INTRADAY] #BANKNIFTY PE & CE Levels(07/03/2025)Flat opening expected in banknifty near 48600 level. After opening if it's sustain above the 48550 then possible it can goes above upto the 48950 level. Major downside possible if banknifty starts trading below 48450 level. Downside it gives 400-500+ points upto the 48050 level.

BANKNIFTY : Intraday Trading levels and plan for 07-Mar-2025
📌 Key Levels to Watch:
🔴 Resistance Levels: 48,944 | 49,151-49,234
🟢 Support Levels: 48,524 | 48,217-48,257
📝 Market Context:
Bank Nifty has shown strength near 48,600, with key resistance at 48,944. A breakout beyond this can trigger further momentum toward 49,100+. On the downside, a breakdown below 48,524 can push prices lower toward 48,217.
📈 Scenario 1: Gap-Up Opening (> 48,800) 🚀
If Bank Nifty opens above 48,800, it indicates bullish momentum. A breakout above 48,944 will confirm further upside.
Buy above 48,944 🔼
🎯 Target: 49,151 – 49,234
🛑 Stop Loss: 48,800
📝 Plan: A sustained move above 48,944 signals strength. Look for volume confirmation before entering. If momentum weakens near 49,151, consider partial profit booking.
Rejection at 48,944 ❌
🔽 Sell below 48,944
🎯 Target: 48,700 – 48,600
🛑 Stop Loss: 49,000
📝 Plan: If price fails to sustain above 48,944 and forms a reversal pattern, a short opportunity arises with a risk-controlled approach.
📉 Scenario 2: Flat Opening (48,450 – 48,650) 📊
A flat opening within 48,450 – 48,650 suggests indecision. We wait for a breakout or breakdown.
Buy above 48,650 🔼
🎯 Target: 48,944
🛑 Stop Loss: 48,500
📝 Plan: If price holds above 48,650, it can retest 48,944. Watch for price action confirmation before entering.
Sell below 48,524 🔽
🎯 Target: 48,300 – 48,217
🛑 Stop Loss: 48,600
📝 Plan: If price rejects 48,600-48,524, a downside move towards 48,217 is possible. Volume confirmation is key for safe entry.
📉 Scenario 3: Gap-Down Opening (< 48,400) ⚠️
A gap-down below 48,400 indicates weakness. Immediate support is at 48,217 – 48,257.
Buy near 48,217 – 48,257 🟢
🎯 Target: 48,524
🛑 Stop Loss: 48,150
📝 Plan: If price stabilizes at 48,217-48,257, it could bounce back towards 48,524. Ideal for risk-managed long positions.
Sell below 48,217 🔽
🎯 Target: 48,012 – 47,900
🛑 Stop Loss: 48,300
📝 Plan: If selling pressure increases, a breakdown below 48,217 could lead to further downside. Avoid panic selling; wait for confirmation.
💡 Risk Management Tips for Options Traders 🎯
✅ Time Decay Awareness: Avoid buying options too late in the session to minimize theta decay.
✅ Stop-Loss Discipline: Always set SL based on chart structure, not emotions.
✅ Position Sizing: Don’t risk more than 2% of your capital per trade.
✅ Avoid Overtrading: Stick to high-probability setups.
📌 Summary & Conclusion 📌
🔹 Bullish above 48,944 for 49,151-49,234.
🔹 Bearish below 48,217 for 48,012-47,900.
🔹 Flat open needs confirmation for direction.
🔹 Key levels to watch: 48,524 support | 48,944 resistance.
📢 Stay disciplined, trade with a plan, and manage risk wisely!
⚠️ Disclaimer:
I am not a SEBI-registered analyst. This analysis is for educational purposes only. Do your own research or consult a financial advisor before trading. 📊📉📈

BANKNIFTY--Triple Bottom + Liquidity= Up ??BANKNIFTY Index is taking the support of 47800 levels multiple times.
its clearly saying that a lot of liquidity is lies below this level of support.
On top side, price created a Head and shoulders pattern.
Buy side::
Case1:
If price takes the liquidity on triple bottom and fails to go down triple bottom(Resistance)
or
Case 2: Strong Confirmation
if price consolidates between the Head and Right shoulder then will wait for a confirmation breakout above the head section on a pullback to Right shoulder then only a complete bullishness is going to observe in this index.
Look for long side below the triple Bottom.
On the topside we have a trendline liquidity near Right shoulder.

BANKNIFTY KEY LEVELS FOR 06/03/2025// All credit goes to Tony for the concept of this indicator. His Trading View link: tradingview.com/u/tony_fx_sm/
// Note: The calculation method in this indicator differs from Tony's, but the concept is derived from his work.
I want to make it clear that I am not a seller, and this method was not taught to me by anyone. The original creator only gave me one clue:
👉 "If you get one level, you get all levels."
Everything else—the way I nail it the method and applied it—is my own work. I respect the original idea, but my approach is independent.
Explanation:
This trading system helps you avoid blind trades by providing confirmation for better entries and exits.
Entry/Exit Points:
- Entry/Exit Lines: Use the BLACK line for long trades and the RED line for short trades, based on confirmation from your trading plan.
- Stop Loss: For long trades, set the stop loss at the RED line below. For short trades, set it at the BLACK line above.
- Take Profit: For long trades, target the next RED line above. For short trades, target the next BLACK line below.
Timeframe:
Use a 5 mins timeframe for trading.
Risk Disclaimer:
This setup is for educational purposes. I'm not responsible for your gains or losses. Check the chart for more details

[INTRADAY] #BANKNIFTY PE & CE Levels(06/03/2025)Today will be gap up opening expected in banknifty. Expected opening above 48550 level. After opening if banknifty sustain above this level then possible upside rally upto 48950. This level will act as a strong resistance for today's session. Any major downside rally expected below 48450 level. This downside rally can goes upto 48050 and can extend further in case breakdown of 48000 level.

BANKNIFTY : Intraday Trading levels and Plan for 06-Mar-2025Market Overview:
Bank Nifty closed at 48,506.40, and the following levels will be crucial for tomorrow’s session:
🔴 Last Intraday Resistance: 48,944
🟥 Opening Support Resistance: 48,713
🟠 Opening Resistance / Support Zone: 48,524
🟩 Opening Support Zone: 48,245 - 48,297
🟢 Last Intraday Support: 48,012
🟢 Strong Downside Support: 47,739
Considering a 200+ point gap opening, let’s analyze the possible trading scenarios.
🟢 Scenario 1: Gap-Up Opening (200+ Points Above 48,700)
If Bank Nifty opens above 48,700, it enters the Opening Support Resistance Zone and approaches the upper supply areas.
Sustaining Above 48,713 – A stable move above this level indicates strength, with potential upside toward the Last Intraday Resistance (48,944).
Rejection at 48,713 – If price fails to hold, a pullback toward the Opening Resistance/Support at 48,524 is likely.
Breakout Above 48,944 – If momentum is strong, expect an extended rally toward 49,100+, but be cautious of profit booking.
📌 Plan of Action:
Buy above 48,713 with a target of 48,944, keeping SL below 48,600.
Sell if 48,713 is rejected, targeting 48,524 with SL above 48,750.
Options traders can use 48,700 CE for longs and 48,900 PE if resistance holds.
🟡 Scenario 2: Flat Opening (Within 48,400 - 48,550)
A flat opening around the Opening Resistance / Support Zone (48,524 - 48,506) suggests a balanced market, requiring confirmation for further direction.
Sustaining Above 48,524 – This level needs to hold for an upside push toward 48,713, with a potential breakout to 48,944.
Breaking Below 48,506 – If price moves downward, the first support lies at 48,297, followed by 48,245.
Sideways Action Between 48,450 - 48,524 – If price consolidates in this range, wait for a decisive breakout before entering a trade.
📌 Plan of Action:
Buy above 48,524, targeting 48,713, with SL at 48,450.
Sell below 48,506, targeting 48,297, with SL at 48,600.
Options traders can use 48,600 CE for bullish trades and 48,400 PE for bearish trades.
🔴 Scenario 3: Gap-Down Opening (200+ Points Below 48,300)
A gap-down below 48,300 brings Bank Nifty into the Opening Support Zone (48,245 - 48,297).
Holding 48,245 – If buyers step in at this level, a bounce toward 48,524 is possible.
Breaking 48,245 – A breakdown signals weakness, with the next target at 48,012 (Last Intraday Support).
Breaking Below 48,012 – If further selling occurs, expect downside till 47,739, where major buying interest might emerge.
📌 Plan of Action:
Buy near 48,245, targeting 48,524, if support holds.
Sell below 48,245, targeting 48,012, with SL at 48,320.
Options traders can consider 48,200 PE for breakdowns and 48,300 CE for rebounds.
📊 Risk Management Tips for Options Trading
✅ Use Stop Loss on an Hourly Close Basis – Avoid holding options if the trend invalidates.
✅ Avoid Trading in Choppy Ranges – Let price break key levels before entering.
✅ Monitor India VIX – High volatility may cause sharp moves, adjust position sizing accordingly.
✅ Use Partial Profit Booking – Lock-in gains at resistance/support levels.
✅ Avoid Holding Positions Overnight – If the market is unclear, carry-forwarding options may lead to overnight risks.
📌 Summary & Conclusion
Bullish Bias: Above 48,713, Bank Nifty can test 48,944.
Range-Bound: If trading between 48,400 - 48,524, wait for a breakout.
Bearish Bias: Below 48,245, weakness can extend toward 48,012 or lower.
📌 Best Risk-Reward Trades:
Buy above 48,713 for 48,944.
Sell below 48,245 for 48,012.
Wait for confirmation in the 48,400 - 48,524 range.
⚠️ Disclaimer:
I am not a SEBI-registered analyst. This analysis is for educational purposes only. Please do your own research or consult a financial advisor before making any trading decisions.

BANK NIFTY S/R for 6/2/25Support and Resistance Levels:
Support Levels: These are price points (green line/shade) where a downward trend may be halted due to a concentration of buying interest. Imagine them as a safety net where buyers step in, preventing further decline.
Resistance Levels: Conversely, resistance levels (red line/shade) are where upward trends might stall due to increased selling interest. They act like a ceiling where sellers come in to push prices down.
Breakouts:
Bullish Breakout: When the price moves above resistance, it often indicates strong buying interest and the potential for a continued uptrend. Traders may view this as a signal to buy or hold.
Bearish Breakout: When the price falls below support, it can signal strong selling interest and the potential for a continued downtrend. Traders might see this as a cue to sell or avoid buying.
MA Ribbon (EMA 20, EMA 50, EMA 100, EMA 200) :
Above EMA: If the stock price is above the EMA, it suggests a potential uptrend or bullish momentum.
Below EMA: If the stock price is below the EMA, it indicates a potential downtrend or bearish momentum.
Trendline: A trendline is a straight line drawn on a chart to represent the general direction of a data point set.
Uptrend Line: Drawn by connecting the lows in an upward trend. Indicates that the price is moving higher over time. Acts as a support level, where prices tend to bounce upward.
Downtrend Line: Drawn by connecting the highs in a downward trend. Indicates that the price is moving lower over time. It acts as a resistance level, where prices tend to drop.
Disclaimer:
I am not a SEBI registered. The information provided here is for learning purposes only and should not be interpreted as financial advice. Consider the broader market context and consult with a qualified financial advisor before making investment decisions.

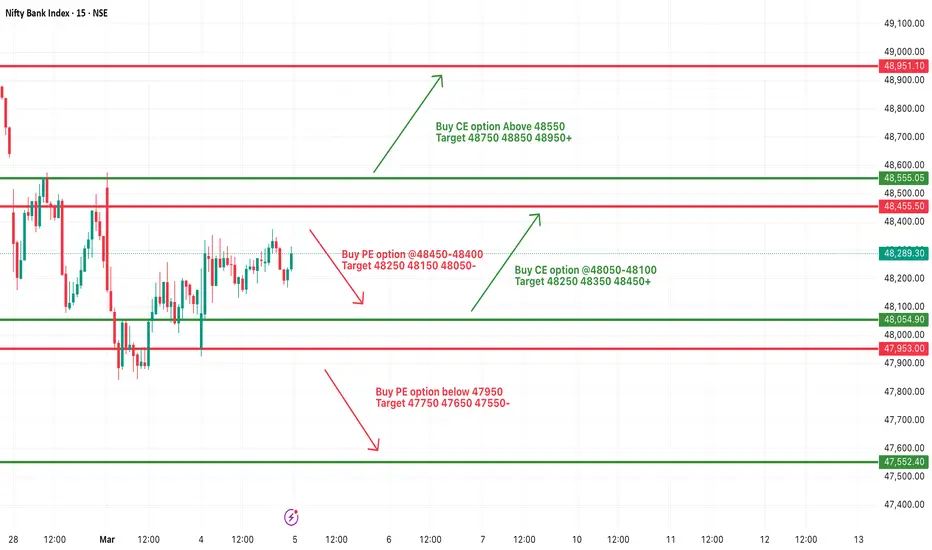
[INTRADAY] #BANKNIFTY PE & CE Levels(05/03/2025)Today will be flat opening expected in index. After opening it will trade in between the 400+ points range from 48050-48400 points. Any strong upside rally only expected above 48550 level. Downside 48050 level will act as a important support for today's session. Any major downside rally only expected below 47950 level.
BANKNIFTY : Intraday Trading Levels and Plan for 05-Mar-2025
Market Context:
Bank Nifty closed at 48,289.30, showing some consolidation near the mid-range of the current structure. The key levels for the day include:
🔴 Resistance Zones:
48,408 – Opening Resistance / Support
48,611 - 48,712 – Last Intraday Resistance Zone
49,114 – Extended Upside Target
🟠 No Trade Zone: 47,954 - 48,106
🟢 Buyer’s Support Zone: 47,363 - 47,573
A 200+ point gap opening should be considered when planning trades. Let's analyze the different opening scenarios.
🟢 Scenario 1: Gap-Up Opening (200+ Points)
If Bank Nifty opens above 48,500, it will enter the Last Intraday Resistance Zone (48,611 - 48,712).
A strong opening with follow-through buying above 48,712 can push Bank Nifty toward 49,114, where profit booking may emerge.
If resistance at 48,712 holds, expect a retracement back to 48,408 (Opening Support). A retest and rejection here may provide a short opportunity.
Traders should wait for a decisive hourly close above or below resistance before entering trades.
🔹 Trading Plan:
Look for a long position only if an hourly candle closes above 48,712, with 49,114 as the target.
If price struggles to sustain above 48,712, watch for a short opportunity targeting 48,408.
Option traders can consider 48,500 CE for long trades or 48,700 PE if rejection is seen.
🟡 Scenario 2: Flat Opening (Within 48,100 - 48,400)
If Bank Nifty opens near 48,289, it will be near the Opening Support/Resistance level (48,408).
Initial movement will determine direction. A breakout above 48,408 may lead to a test of 48,712, whereas rejection can lead to a retest of the No Trade Zone.
If price enters the No Trade Zone (47,954 - 48,106), it's best to wait for a clear direction rather than forcing trades.
A break below 47,954 could lead to weakness, targeting the Buyer’s Support Zone (47,363 - 47,573).
🔹 Trading Plan:
Avoid trading inside the No Trade Zone.
Look for confirmation of support at 48,106 before entering long trades.
A rejection from 48,408 can provide a short opportunity toward 48,106.
🔴 Scenario 3: Gap-Down Opening (200+ Points Below)
If Bank Nifty opens near or below 47,900, it will enter a bearish phase with possible testing of the Buyer’s Support Zone (47,363 - 47,573).
The first reaction from this zone is crucial. A bounce from 47,363 can provide a high reward long trade opportunity.
If Bank Nifty sustains below 47,954, avoid aggressive longs unless a strong reversal signal appears.
Breakdown below 47,363 can open the gates for further downside, making 47,000 - 47,100 the next potential target.
🔹 Trading Plan:
If price holds 47,363, a long trade can be considered with targets of 47,954 - 48,100.
If price fails to hold, a short position can be taken with a target of 47,100.
Option traders can use 47,500 PE for breakdown trades and 47,400 CE for reversals.
💡 Risk Management Tips for Options Trading
✅ Use Stop Loss on an Hourly Close Basis – Avoid holding options without confirmation of direction.
✅ Trade Small in No Trade Zones – Wait for a breakout or rejection before increasing position size.
✅ Monitor India VIX – If volatility spikes, avoid aggressive short selling.
✅ Book Profits at Resistance & Support Levels – Avoid holding options till expiry unless confident in direction.
✅ Stay Disciplined – If market structure changes, be quick to adapt rather than forcing trades.
📌 Summary & Conclusion
Bullish Scenario: Above 48,712, Bank Nifty can rally toward 49,114.
Neutral Zone: If trading between 47,954 - 48,408, wait for confirmation before trading.
Bearish Scenario: Below 47,954, weakness can extend toward 47,363, where a bounce is expected.
🔹 Best Risk-Reward Trades:
Buy near 47,363 if support holds.
Sell below 47,954 for a breakdown.
Buy only on a confirmed breakout above 48,712.
⚠️ Disclaimer:
I am not a SEBI-registered analyst. This analysis is for educational purposes only. Please conduct your own research or consult a financial advisor before making any trading decisions.

Bank Nifty Trend DirectionBNF 48344 - Has resistance at 49590 and Support at 47898.
Breakdown of support will take BNF down to 45660

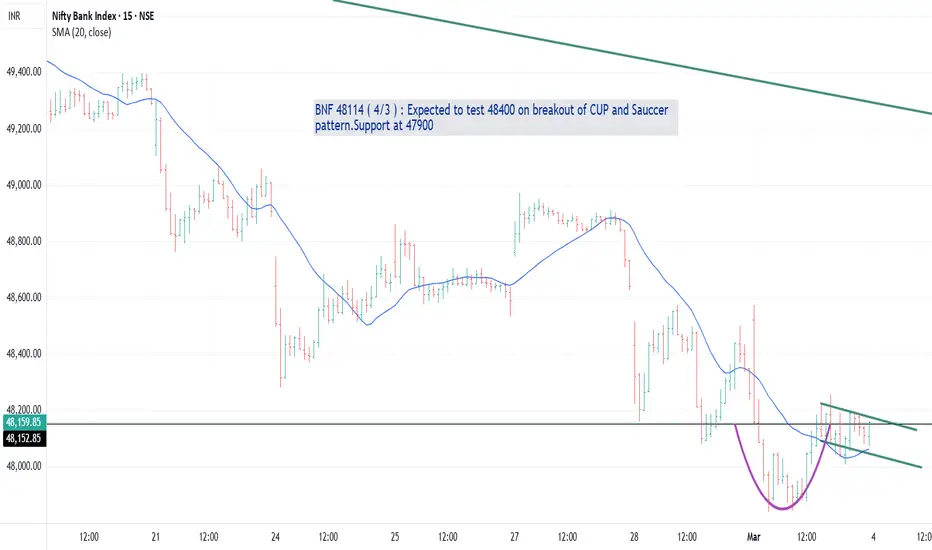
BankNifty Trend DirectionBNF 48114 ( 4/3/2025 ) : Expected to test 48400 on breakout of CUP and Handle pattern.Support at 47900

[INTRADAY] #BANKNIFTY PE & CE Levels(04/03/2025)Today will be slightly gap down opening expected in market. After opening important level for banknifty is 48050. If it is sustain above this level then expected upside rally upto the 48450 level. Major downside expected below 47950. This downside can be possible of 400-500+ points in index. Upside 48450 level will act as a strong resistance for today's session.

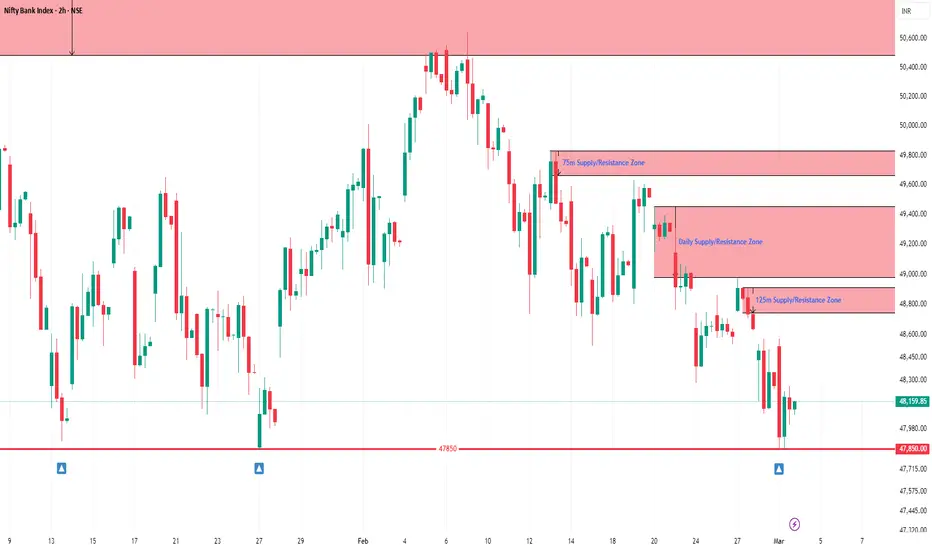
BankNifty Intraday Support & Resistance Levels for 04.03.2025Monday’s session saw BankNifty opening with a gap-up, hitting a high of 48,574.70, but it couldn’t hold and dropped to a low of 47,841.30. However, it recovered slightly and closed at 48,114.30, losing 230 points from the previous close. Both the Weekly Trend (50 SMA) and Daily Trend (50 SMA) remain negative.
Demand/Support Zones
Near Support: Around 47,850 (Triple Bottom on Daily Chart)
Far Support: 46,077.85 (Low of 4th June 2024)
Far Demand/Support Zone (Daily): 44,633.85 - 45,750.40
Supply/Resistance Zones
Near Supply/Resistance Zone (125m): 48,743.80 - 48,911.90
Near Supply/Resistance Zone (Daily): 48,981.20 - 49,455.80
Far Supply/Resistance Zone (75m): 49,665.95 - 49,829.40
Far Supply/Resistance Zone (Weekly): 50,485.05 - 51,979.75 (Tested)
Outlook
BankNifty has dropped 6,626 points (12%) in the last 5 months from its All-Time High of 54,467.35. Today’s low of 47,841.30 is very close to the previous lows on 13th Jan 2025 (47,898.35) and 27th Jan 2025 (47,844.15), forming a potential Triple Bottom around 47,850. The index closed above 48,000, which could indicate a short-term bounce if the support holds. However, multiple supply zones above suggest strong selling pressure at higher levels. Any upside move may face resistance, making a Sell-on-Rise strategy more favorable until a breakout is confirmed.
BANKNIFTY FOR 04 MARCH 20251. Strong Resistance at 48,766.90
2. Breakout Level: 48,330.55 (Black Line)
If it reclaims 48,330.55, we might see bullish momentum again
3. Support Levels:
Support-1: 48,081.05
Support-2: 47,918.85
Strong Support: 47,668.00
If this level breaks, further downside expected.
4. Possible Scenarios:
Bullish above 48,330, targeting 48,420 - 48,656.90.
Bearish below 47,918, targeting 47,668.

BANKNIFTY : Intraday Trading levels and plan for 04-Mar-2025
This analysis provides a comprehensive trading plan for the BANKNIFTY index on March 4, 2025, covering all possible opening scenarios. We will evaluate Gap-Up, Flat, and Gap-Down openings (with gaps of 200+ points) and outline clear action points, key levels, and risk management strategies. This plan is designed to help traders navigate the market with precision and discipline. 📈🔍
🔹 Scenario 1: Gap-Up Opening (200+ points)
If BANKNIFTY opens above 49,131 (a gap of 200+ points from the previous close of 48,931), it signals strong bullish momentum. This opening suggests a potential reversal from recent support levels, indicating aggressive buying interest.
If the price sustains above 49,131, it could target the profit-booking zone of 49,653–49,760. This zone is a key resistance area where selling pressure may intensify due to historical resistance and recent highs.
If the price faces rejection at 49,653–49,760, a reversal trade could be considered, targeting a pullback to 48,225–48,931 (opening support/resistance and previous close).
Should the price break above 49,760 with strong momentum (e.g., high volume and bullish candlestick patterns), we might see a rally toward 50,000 or higher.
✅ Trade Plan:
✔️ Buy on a breakout and retest of 49,131 , targeting 49,653–49,760. Use a stop-loss below 48,931 to manage risk.
✔️ Short if the price rejects 49,653–49,760, aiming for 48,225–48,931. Place a stop-loss above 49,760 to limit potential losses.
Explanation: A Gap-Up opening of 200+ points suggests a strong bullish reversal from the 47,573–47,363 support zone. Waiting for a retest of 49,131 confirms bullish intent, while the resistance at 49,653–49,760 acts as a natural profit-taking zone. A rejection at this level could signal a shorting opportunity if bearish momentum resurfaces.
🔹 Scenario 2: Flat Opening (Near 48,931–48,225)
If BANKNIFTY opens within the range of 48,931–48,225, it suggests a balanced market with no clear directional bias, likely consolidating near recent support and resistance levels. This zone acts as a critical opening support/resistance area.
A breakout above 48,225 could drive prices toward 49,653–49,760, signaling bullish momentum and a possible trend reversal.
A breakdown below 48,931 might lead to selling pressure, targeting 47,573–47,363 (buyer’s support/must-try zone) or even 47,300 (key support level).
✅ Trade Plan:
✔️ Buy above 48,225 , targeting 49,653–49,760. Use a stop-loss below 48,931 to protect against a false breakout.
✔️ Sell below 48,931 , targeting 47,573–47,363 or 47,300. Set a stop-loss above 48,225 to manage downside risk.
Explanation: A Flat opening within the 48,931–48,225 range indicates the market is in a consolidation phase, a no-trade zone unless a breakout occurs. Traders should wait for clear price action (e.g., strong candlestick patterns or increased volume) to confirm a breakout above 48,225 for a bullish move or a breakdown below 48,931 for a bearish move, avoiding premature entries.
🔹 Scenario 3: Gap-Down Opening (200+ points)
If BANKNIFTY opens below 48,731 (a gap of 200+ points from the previous close of 48,931), it signals bearish sentiment and potential weakness, testing lower support levels.
Immediate support lies at 47,573–47,363 (buyer’s support/must-try zone). If this holds, a pullback toward 48,931–48,225 could occur.
If 47,363 breaks with strong selling pressure, expect further downside toward 47,300 (key support level for a possible reversal).
✅ Trade Plan:
✔️ Buy near 47,573 , targeting a pullback to 48,931–48,225. Use a stop-loss below 47,363 to limit risk.
✔️ Short below 47,363 , targeting 47,300. Place a stop-loss above 47,573 to protect against a quick recovery.
Explanation: A Gap-Down opening of 200+ points suggests continued downward pressure, but support at 47,573–47,363 could trigger a rebound if it holds. Waiting for confirmation near 47,573 ensures the price isn’t just oversold, while a break below 47,363 confirms bearish momentum for shorting. The 47,300 zone is a critical level for a potential reversal if buying interest emerges.
📌 Risk Management Tips for Options Trading 💡
🛑 Always Use a Strict Stop-Loss: Protect your capital by setting stop-loss orders at key support/resistance levels to limit potential losses.
🎯 Take Partial Profits: Lock in gains at intermediate targets (e.g., 49,653 or 47,573) to secure profits while allowing room for further moves.
🕰️ Avoid Overtrading: Stick to the plan and wait for clear price action confirmation—don’t force trades in uncertain conditions.
💰 Use Proper Position Sizing: Risk only a small percentage of your capital (e.g., 1–2%) per trade to ensure longevity in the market.
📌 Summary & Conclusion 🎯
✔️ Bullish Above: 48,225 → Target: 49,653–49,760.
✔️ Bearish Below: 48,931 → Target: 47,573–47,363 or 47,300.
✔️ No Trade Zone: 48,931–48,225 (Wait for a breakout).
Trade with discipline, follow your plan, and prioritize risk management to navigate the BANKNIFTY market effectively on March 4, 2025. 🚀
⚠️ Disclaimer
I am not a SEBI-registered analyst. This analysis is for educational purposes only. Please consult your financial advisor before making any trading decisions. 📉📈

[INTRADAY] #BANKNIFTY PE & CE Levels(03/03/2025)Today will be gap up opening expected in index near 48500 level. After opening expected reversal from this level for further downside in market. Major downside expected if banknifty starts trading below 47950 level this downside rally can goes upto 47550 level. Any bullish rally only expected if banknifty starts trading and sustain above 48550 level.