Banknifty Levels For tomorrowNSE:BANKNIFTY
banknifty had passed its downtrend now we can see upcoming big move in uptrend .
#sbi report impact
#repo rate impact
BANKNIFTY trade ideas

BANKNIFTY : Trading Levels and Plan for 20-Feb-2025This analysis covers all possible opening conditions for BANKNIFTY on 20-Feb-2025 and provides a structured trading plan. We will consider:
✅ Gap-Up Opening (200+ points)
✅ Flat Opening (Near 49,577 - 49,658)
✅ Gap-Down Opening (200+ points)
Each scenario has clear action points and risk management tips. 📈🔥
🔹 Scenario 1: Gap-Up Opening (200+ points)
If BANKNIFTY opens above 49,658, this suggests bullish momentum.
Sustaining above 49,658 can push the index towards 50,000 - 50,193 (Profit Booking Zone).
At 50,000 - 50,193, expect resistance—if price rejects here, a reversal trade is possible targeting 49,700 - 49,600.
If price breaks 50,193 with strength, we may see a new rally towards 50,350+ levels.
✅ Trade Plan:
✔️ Buy on a breakout & retest of 49,658, targeting 50,000 - 50,193.
✔️ Short if price rejects 50,193, aiming for 49,700 - 49,600.
⚠️ Risk Tip: Avoid chasing a strong gap-up immediately. Wait for price to settle before taking a position.
🔹 Scenario 2: Flat Opening (Near 49,519 - 49,658)
If BANKNIFTY opens within the 49,577 - 49,658 zone, this could act as an Opening Resistance/Support zone.
A breakout above 49,658 can push prices towards 50,000 - 50,193.
A breakdown below 49,401 (Opening Support) may lead to selling pressure, targeting 49,336 - 49,095.
✅ Trade Plan:
✔️ Buy above 49,658, targeting 50,000 - 50,193.
✔️ Sell below 49,401, targeting 49,336 - 49,095.
⚠️ Risk Tip: Avoid trading in the 49,500 - 49,600 range unless a strong breakout happens. Consolidation in this zone can lead to fake moves.
🔹 Scenario 3: Gap-Down Opening (200+ points)
If BANKNIFTY opens below 49,336, it signals weakness.
Immediate support exists at 49,095 - 49,000 (Last Intraday Support). If this holds, expect a possible pullback towards 49,400 - 49,500.
If 49,095 breaks, expect further downside towards 48,760.
✅ Trade Plan:
✔️ Buy near 49,095, targeting a pullback to 49,401 - 49,519.
✔️ Short below 49,095, targeting 48,760 and lower.
⚠️ Risk Tip: If BANKNIFTY gaps down but quickly recovers 49,095, avoid shorts and wait for price confirmation before entering trades.
📌 Risk Management Tips for Options Trading 💡
🛑 Always use a strict stop-loss to protect capital.
🎯 Take partial profits at key levels to lock in gains.
🕰️ Avoid overtrading—wait for price action confirmation.
💰 Use proper position sizing to manage risk.
📌 Summary & Conclusion 🎯
✔️ Bullish Above: 49,658 → Target: 50,000 - 50,193.
✔️ Bearish Below: 49,401 → Target: 49,336 - 49,095.
✔️ No Trade Zone: 49,500 - 49,600 (Wait for breakout).
Trade with a plan, manage risk wisely, and stay disciplined. ✅🚀
⚠️ Disclaimer
I am not a SEBI-registered analyst. This analysis is for educational purposes only. Please consult your financial advisor before making any trades. 📉📈

BANK NIFTY | REVERSAL | LONGBANK NIFTY has been forming Higher Lows since Jan last week.
Each time the price breaks down from the Weekly Support, there is instant buying.
This is indicative of the fact that there are Buyers.
A Long Swing position can be taken on Bank Nifty preferably for the March series considering the fact that there are only 5 trading sessions left until Feb series expiry.
Main contributors towards this rally could be HDFC BANK & AXIS BANK.
As per my analysis, BN could test 50,750 levels in the coming week.

#BANKNIFTY Intraday 19/02/2025Bank Nifty, which represents the performance of the banking sector in India, is one of the most liquid and volatile indices for intraday trading. Trading reversals from supply zones (resistance areas) can be a highly effective strategy for intraday traders.

Bank Nifty Analysis & Trading Plan (5-Min Timeframe)Current Price: 49,064.15 (-0.35%)
Key Levels:
Resistance Zone: 50,400
Support Zone: 48,800
Breakout/Breakdown Levels:
Bullish breakout above 49,200 → Possible move towards 50,400
Bearish breakdown below 48,800 → Target towards 47,993
Trade Setup:
Bullish Scenario:
If price sustains above 49,200, look for buying opportunities with targets at 50,400.
A strong breakout above 50,400 can push the index towards 51,000+.
Bearish Scenario:
If price breaks below 48,800, expect further downside towards 47,993.
Short positions can be taken below 48,800 with SL at 49,200.

[INTRADAY] #BANKNIFTY PE & CE Levels(19/02/2025)The Banknifty indicates a flat opening today, with the index currently hovering around 49050. Key levels suggest a potential breakout or breakdown scenario depending on market movement. On the upside, if Bank Nifty moves above the 49050-49100 zone, can look to long with targets at 49250, 49350 and 49450+.
Conversely, a breakdown below the 48950-48900 level could trigger a bearish move, making downside with targets at 48750, 48650, and 48550-. The major support level lies at 48545, which could act as a strong demand zone if the index falls further.
The current price action, the market is expected to open within this defined range, indicating a flat start. The direction for the day will be determined by whether Bank Nifty sustain above 49050 for a bullish rally or falls below 48950 for a bearish trend. Until then, sideways movement is likely, and should wait for confirmation before entering any trades.

BANKNIFTY : Trading levels and plan for 19-Feb-2025
🔹 Key Levels for the Day:
📈 Resistance Zone: 49,208 - 49,659
📉 Support Zone: 48,918 - 48,600
🔄 Profit Booking Zone: 49,579 - 49,659
📍 Scenario 1: Gap-Up Opening (200+ points)
If BANKNIFTY opens with a gap-up above 49,208 , we need to observe whether it sustains above this level.
If it holds above 49,208, we can expect an upside movement towards 49,579 - 49,659 (profit booking zone).
A breakout above 49,659 can take it towards 50,001, but with caution as profit booking may occur.
In case of rejection from 49,659, look for a shorting opportunity back towards 49,208.
🔹 Trade Plan: Buy on dips near 49,208 with SL below 49,100 for a target of 49,579. If rejected from 49,659, initiate a short trade with SL above 49,700.
📍 Scenario 2: Flat Opening (Within 49,039 - 49,208)
If BANKNIFTY consolidates between 49,039 - 49,208, wait for a decisive breakout.
A breakout above 49,208 can push prices towards 49,579.
A breakdown below 49,039 will lead to a decline towards 48,918 - 48,600.
🔹 Trade Plan: Buy on breakout of 49,208 with SL below 49,100 for targets of 49,579+. If it breaks below 49,039, go short with SL above 49,100 for a target of 48,918.
📍 Scenario 3: Gap-Down Opening (200+ points below 48,918)
If BANKNIFTY opens below 48,918, we need to see if it finds support near 48,600 (last intraday support).
A bounce from 48,600 can lead to a recovery towards 48,918.
If 48,600 breaks, expect further downside towards 48,400-48,300.
🔹 Trade Plan: Look for a buying opportunity near 48,600 with SL below 48,500 for a potential bounce towards 48,918. If 48,600 breaks, short for a target of 48,400-48,300.
💡 Risk Management Tips for Options Trading 💡
✅ Always maintain a proper stop-loss (SL) to manage risk.
✅ Avoid buying deep OTM options unless you have a high conviction breakout.
✅ For intraday trading, focus on ATM or slightly ITM options for better risk-reward.
✅ If volatility is high, switch to spreads like Bull Call Spread or Bear Put Spread to reduce risk.
✅ Book partial profits as levels are achieved to lock in gains.
🔎 Summary & Conclusion
📌 Upside movement expected above 49,208 targeting 49,579-49,659. A rejection here can push prices lower.
📌 Breakdown below 49,039 can take it towards 48,918, with 48,600 being a critical support.
📌 Risk management is key— stick to your stop-loss!
⚠️ Disclaimer: I am not a SEBI-registered analyst. This analysis is for educational purposes only. Please trade at your own risk. 📊📉📈

[INTRADAY] #BANKNIFTY PE & CE Levels(18/02/2025)Flat opening expected in banknifty. After opening banknifty will trade in between the zone of 49050-49450 level. Any major upside rally expected above the 49550 resistance level. Similarly strong downside expected below 48950. For today's session 49050 will act as a major downside support level for banknifty.

BANK NIFTY S/R for 18/2/25Support and Resistance Levels:
Support Levels: These are price points (green line/shade) where a downward trend may be halted due to a concentration of buying interest. Imagine them as a safety net where buyers step in, preventing further decline.
Resistance Levels: Conversely, resistance levels (red line/shade) are where upward trends might stall due to increased selling interest. They act like a ceiling where sellers come in to push prices down.
Breakouts:
Bullish Breakout: When the price moves above resistance, it often indicates strong buying interest and the potential for a continued uptrend. Traders may view this as a signal to buy or hold.
Bearish Breakout: When the price falls below support, it can signal strong selling interest and the potential for a continued downtrend. Traders might see this as a cue to sell or avoid buying.
20 EMA (Exponential Moving Average):
Above 20 EMA(50 EMA): If the stock price is above the 20 EMA, it suggests a potential uptrend or bullish momentum.
Below 20 EMA: If the stock price is below the 20 EMA, it indicates a potential downtrend or bearish momentum.
Trendline: A trendline is a straight line drawn on a chart to represent the general direction of a data point set.
Uptrend Line: Drawn by connecting the lows in an upward trend. Indicates that the price is moving higher over time. Acts as a support level, where prices tend to bounce upward.
Downtrend Line: Drawn by connecting the highs in a downward trend. Indicates that the price is moving lower over time. It acts as a resistance level, where prices tend to drop.
Disclaimer:
I am not a SEBI registered. The information provided here is for learning purposes only and should not be interpreted as financial advice. Consider the broader market context and consult with a qualified financial advisor before making investment decisions.

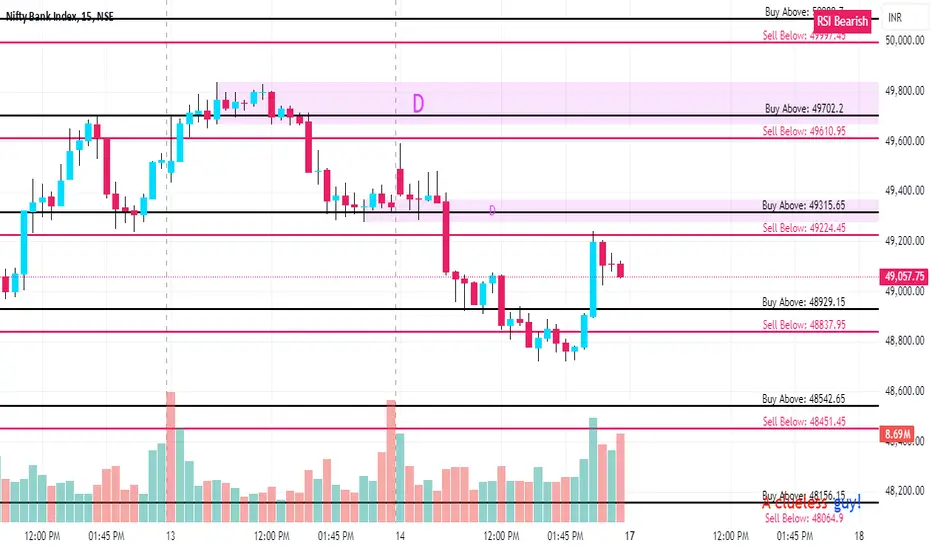
BANKNIFTY KEY LEVELS FOR 18/02/2025//description
// All credit goes to Tony for the concept of this indicator. His Trading View link: www.tradingview.com
// Note: The calculation method in this indicator differs from Tony's, but the concept is derived from his work.
I want to make it clear that I am not a seller, and this method was not taught to me by anyone. The original creator only gave me one clue:
👉 "If you get one level, you get all levels."
Everything else—the way I nail it the method and applied it—is my own work. I respect the original idea, but my approach is independent.
Explanation:
This trading system helps you avoid blind trades by providing confirmation for better entries and exits.
Entry/Exit Points:
- Entry/Exit Lines: Use the BLACK line for long trades and the RED line for short trades, based on confirmation from your trading plan.
- Stop Loss: For long trades, set the stop loss at the RED line below. For short trades, set it at the BLACK line above.
- Take Profit: For long trades, target the next RED line above. For short trades, target the next BLACK line below.
Timeframe:
Use a 5 mins timeframe for trading.
Risk Disclaimer:
This setup is for educational purposes. I'm not responsible for your gains or losses. Check the chart for more details.

BANKNIFTY : Trading Plan for 18-Feb-2025🔹 Key Levels to Watch
Opening Resistance / Support Zone: 49,435 - 49,332
Last Intraday Resistance: 49,676 - 49,802
Opening Support Zone: 48,920 - 48,993
Last Intraday Support: 48,696
🟢 Scenario 1: Gap-Up Opening (200+ Points Above Previous Close)
If BANKNIFTY opens above 49,435, it enters a crucial resistance zone.
A rejection from 49,676 - 49,802 may lead to a shorting opportunity with targets at 49,435 - 49,332.
If price sustains above 49,802, expect a breakout move towards 49,997, with momentum building.
Safe traders should wait for retests at support levels before entering trades.
📌 Plan of Action:
🔹 Look for bearish rejection signals at resistance for a short trade.
🔹 If the price breaks out with volume, go long with a stop-loss below 49,676.
⚖ Scenario 2: Flat Opening (Within 100 Points of Previous Close)
If BANKNIFTY opens around 49,279 - 49,228, we are in a neutral zone.
Holding above 49,332 could push price towards 49,676.
A break below 49,228 could trigger selling towards 48,993.
Avoid trades in choppy price action; wait for confirmation.
📌 Plan of Action:
🔹 Wait for price confirmation at 49,332 before taking positions.
🔹 Trade only after a clear trend is established.
🔴 Scenario 3: Gap-Down Opening (200+ Points Below Previous Close)
If BANKNIFTY opens near or below 48,920, it enters a support zone.
Holding 48,920 - 48,696 can lead to a bounce back to 49,228 - 49,332.
Breaking below 48,696 could see strong selling pressure towards lower levels.
📌 Plan of Action:
🔹 Look for bullish price action at support for long trades.
🔹 If price sustains below 48,696, consider shorting with a stop-loss above the resistance zone.
⚠️ Risk Management Tips for Options Trading
✅ Position Sizing: Trade with small lot sizes in volatile conditions.
✅ Stop-Loss Discipline: Always set SL and stick to it!
✅ Avoid Overtrading: Enter only on confirmed setups.
✅ Time Decay Awareness: Avoid holding options overnight unless confident about direction.
📌 Summary & Conclusion
Bullish Bias above 49,435, targeting 49,676 - 49,997.
Bearish Breakdown below 48,920, targeting 48,696 - 48,500.
Flat Openings require confirmation before entering trades.
🚨 Disclaimer: I am not a SEBI-registered analyst. This analysis is for educational purposes only. Trade at your own risk.

Banknifty Demand Zone The Bank Nifty is an index that represents the performance of the banking sector in India, comprising the most liquid and large-cap banking stocks listed on the National Stock Exchange (NSE). A demand zone in the context of Bank Nifty refers to a price area where buying interest is historically strong, often acting as a support level. If the Bank Nifty is approaching or reacting to a demand zone, it could indicate a potential reversal or bounce.

[INTRADAY] #BANKNIFTY PE & CE Levels(17/02/2025)Today will be flat opening expected in banknifty. After opening if banknifty starts trading below 48950 level then possible further major downside of 400-500+ points in index. 49050 level will act as a support for today's session. Any upside move only expected if banknifty sustain above this level. Upside 49450 level is the crucial resistance index. Any upside rally can be reversal from this level.

Technical analysis of Bank nifty Bank Nifty (5-min chart)
Plan: Price demand zone se bounce le sakta hai ya breakdown hoke lower zone test karega.
Levels:
Upside target: 49,400 - 49,600 resistance zone.
Downside target: 48,800 - 48,400 demand zone.
Volume Analysis: Higher volumes breakout ko support karenge.

BANKNIFTY : Trading levels and Plan for 17-Feb-2025🔍 Market Context:
BANKNIFTY has been volatile with key resistance and support levels forming strong zones. A structured approach is necessary to navigate different opening scenarios effectively.
---
1. Gap-Up Opening (200+ Points) Scenario
If BANKNIFTY opens above 49,242 , it enters the Opening Resistance/Support zone.
A rejection here can trigger a short trade , targeting 48,827 .
Sustained buying above 49,242 may lead to a rally toward the next resistance at 49,800 .
Breakout above 49,800? Expect a push toward 49,984 , where partial profit booking is advised.
🔹 Action Plan:
✅ Watch for rejection at 49,242 – Short with SL above 49,300.
✅ If breakout and sustain above 49,242 , go long for 49,800 .
✅ Above 49,800 , confirm strength before fresh longs.
💡 Tip: In a gap-up, options premiums are inflated. Use spreads instead of naked options.
---
2. Flat Opening (Within 49,070-49,242)
A flat open suggests uncertainty – potential No Trade Zone .
A breakout above 49,242 confirms bullishness.
A breakdown below 49,070 invites selling toward 48,827 .
🔹 Action Plan:
✅ Avoid aggressive trades in the 49,070-49,242 range (No Trade Zone).
✅ If price moves above 49,242 , take longs with SL below 49,070 .
✅ Below 49,070 , short for 48,827 .
💡 Tip: Wait 15-30 minutes before entering trades in flat openings to avoid fake breakouts.
---
3. Gap-Down Opening (200+ Points Below 48,827)
A gap-down near/below 48,827 signals bearish sentiment.
48,461 is key intraday support – breaking below leads to further downside.
A pullback to 48,827 may offer a shorting opportunity if resistance holds.
🔹 Action Plan:
✅ If below 48,827 , go short targeting 48,461 .
✅ Watch for a bounce at 48,461 – a strong recovery may trigger reversals.
✅ If recovery sustains above 48,827 , consider longs with SL below 48,750 .
💡 Tip: In a gap-down, IV spikes, increasing option prices. Selling OTM calls can benefit from premium decay.
---
⚠ Risk Management & Options Trading Tips
🔹 Never overleverage – Always define a stop loss before entering a trade.
🔹 Use spreads – Instead of buying naked options, use vertical spreads to limit risk.
🔹 Watch for traps – Avoid chasing prices at the open; let the market structure develop.
🔹 Be mindful of time decay – For long options trades, prefer ATM strikes to minimize theta decay.
---
📌 Summary & Conclusion
✅ Key Levels to Watch:
- Resistance: 49,242 / 49,800
- Support: 48,827 / 48,461
✅ Trading Plan Overview:
- Gap-Up: Watch for rejection at 49,242 , breakout potential toward 49,800 .
- Flat Open: No Trade Zone in 49,070-49,242 – wait for confirmation.
- Gap-Down: Below 48,827 , bearish trend continues toward 48,461 .
💡 Final Tip: Stick to your trading plan and avoid emotional decisions. Trading is about discipline, not predictions!
---
📢 Disclaimer:
I am not a SEBI registered analyst . This trading plan is for educational purposes only . Please do your own research before taking any trades. 📊

BANK NIFTY S/R for 17/2/25Support and Resistance Levels:
Support Levels: These are price points (green line/shade) where a downward trend may be halted due to a concentration of buying interest. Imagine them as a safety net where buyers step in, preventing further decline.
Resistance Levels: Conversely, resistance levels (red line/shade) are where upward trends might stall due to increased selling interest. They act like a ceiling where sellers come in to push prices down.
Breakouts:
Bullish Breakout: When the price moves above resistance, it often indicates strong buying interest and the potential for a continued uptrend. Traders may view this as a signal to buy or hold.
Bearish Breakout: When the price falls below support, it can signal strong selling interest and the potential for a continued downtrend. Traders might see this as a cue to sell or avoid buying.
20 EMA (Exponential Moving Average):
Above 20 EMA(50 EMA): If the stock price is above the 20 EMA, it suggests a potential uptrend or bullish momentum.
Below 20 EMA: If the stock price is below the 20 EMA, it indicates a potential downtrend or bearish momentum.
Trendline: A trendline is a straight line drawn on a chart to represent the general direction of a data point set.
Uptrend Line: Drawn by connecting the lows in an upward trend. Indicates that the price is moving higher over time. Acts as a support level, where prices tend to bounce upward.
Downtrend Line: Drawn by connecting the highs in a downward trend. Indicates that the price is moving lower over time. It acts as a resistance level, where prices tend to drop.
Disclaimer:
I am not a SEBI registered. The information provided here is for learning purposes only and should not be interpreted as financial advice. Consider the broader market context and consult with a qualified financial advisor before making investment decisions.

Banknifty Weekly View - February 3rd week.Banknifty is looking uncertain and we can expect high volatility throughout the week. Imp range on the downside would be 48500-47400 and in between an imp support would be 47986. On the upside banknifty can give upside only if it successfully crosses and sustains above 49776 and it can go upto 50300-600.

BANKNIFTY KEY LEVELS FOR 17/02/2025//description
// All credit goes to Tony for the concept of this indicator. His Trading View link: www.tradingview.com
// Note: The calculation method in this indicator differs from Tony's, but the concept is derived from his work.
I want to make it clear that I am not a seller, and this method was not taught to me by anyone. The original creator only gave me one clue:
👉 "If you get one level, you get all levels."
Everything else—the way I nail it the method and applied it—is my own work. I respect the original idea, but my approach is independent.
Explanation:
This trading system helps you avoid blind trades by providing confirmation for better entries and exits.
Entry/Exit Points:
- Entry/Exit Lines: Use the BLACK line for long trades and the RED line for short trades, based on confirmation from your trading plan.
- Stop Loss: For long trades, set the stop loss at the RED line below. For short trades, set it at the BLACK line above.
- Take Profit: For long trades, target the next RED line above. For short trades, target the next BLACK line below.
Timeframe:
Use a 5 mins timeframe for trading.
Risk Disclaimer:
This setup is for educational purposes. I'm not responsible for your gains or losses. Check the chart for more details.
BankNifty Intraday Support & Resistance Levels for 17.02.2025Friday’s session saw BankNifty opening positive, but it failed to hold gains. After touching a high of 49,592.95, it witnessed a sharp decline to 48,719.75 before recovering slightly. It finally closed at 49,099.45, losing 260 points from the previous close. The Weekly Trend (50 SMA) remains negative, while the Daily Trend (50 SMA) is sideways, indicating uncertainty in direction.
Demand/Support Zones
Near Demand/Support Zone (125m): 47,981.35 - 48,319.20
Far Support Level: 46,077.85 (Low of 4th June 2024)
Far Demand/Support Zone (Daily): 44,633.85 - 45,750.40
Supply/Resistance Zones
Near Supply/Resistance Zone (75m): 49,276.10 - 49,592.95
Near Supply/Resistance Zone (30m): 49,665.95 - 49,743.15
Far Supply/Resistance Zone (30m): 50,146.10 - 50,248.35
Far Supply/Resistance Zone (Weekly): 50,485.05 - 51,979.75 (Tested)
Far Supply/Resistance Zone (Weekly): 52,264.55 - 53,775.10
Outlook
BankNifty’s failure to sustain gains suggests that sellers remain dominant at higher levels. A break below 48,700 could lead to further weakness toward 48,320 - 47,980 or even 46,000, while a move above 49,750 may bring 50,250 - 51,000 into play.

BANK NIFTY | SHORT | SWINGBANK NIFTY is showing further weakness and has rejected the Weekly Support-1 level.
This means a further correction towards 48,188.
However, I do feel that BN will take support around 48,188 levels and we might see a further upmove in the coming weeks.

ARE YOU EXITED TO GO LONG BANKNIFTY!After making Double bottom pattern, Banknifty retested it successfully, it seems to be short term bullish after giving rejection and follow-up bullish candle today on daily chart. a good risk reward ratio 1:2 go long.
Technal key Factor:
RSI above 50
Near 100 Weekly Ema
:
:
Entry above -49700
Target 1st -50611
Target 2nd -51666
Exit/SL - 48500

[INTRADAY] #BANKNIFTY PE & CE Levels(14/02/2025)Today will be slightly gap up opening in banknifty. Since few days banknifty trading in between the range of 49050-49950 level. After opening if it's sustain above 49550 level then possible upside rally upto 49950 resistance level. Similarly downside expected below 49450 level and this can goes upto 49050 support level.

BANKNIFTY Key levels for 14/02/2025//description
// All credit goes to Tony for the concept of this indicator. His Trading View link: www.tradingview.com
// Note: The calculation method in this indicator differs from Tony's, but the concept is derived from his work.
I want to make it clear that I am not a seller, and this method was not taught to me by anyone. The original creator only gave me one clue:
👉 "If you get one level, you get all levels."
Everything else—the way I nail it the method and applied it—is my own work. I respect the original idea, but my approach is independent.
Explanation:
This trading system helps you avoid blind trades by providing confirmation for better entries and exits.
Entry/Exit Points:
- Entry/Exit Lines: Use the BLACK line for long trades and the RED line for short trades, based on confirmation from your trading plan.
- Stop Loss: For long trades, set the stop loss at the RED line below. For short trades, set it at the BLACK line above.
- Take Profit: For long trades, target the next RED line above. For short trades, target the next BLACK line below.
Timeframe:
Use a 5 mins timeframe for trading.
Risk Disclaimer:
This setup is for educational purposes. I'm not responsible for your gains or losses. Check the chart for more details.
