BANKNIFTY : Trading levels and Plan for 14-Feb-2025🔹 Key Levels:
📌 Resistance Zones:
🔴 Profit Booking Zone: 50,328 – 50,440
🔴 Last Intraday Resistance: 50,025
🔴 Opening Resistance: 49,690
📌 Support Zones:
🟢 Opening Support/Resistance: 49,280 – 49,342
🟢 Strong Support: 48,970 – 49,070
🟢 Deeper Support Zone: 48,594
📌 EMA: Price is reacting to the moving average, which could act as dynamic support/resistance.
📊 1️⃣ Gap-Up Opening (200+ points above previous close)
If BANKNIFTY opens above 49,690:
Watch for rejection at 50,025: If price struggles, consider a short trade with SL above 50,100. Target: 49,690 – 49,400.
Sustained breakout of 50,025? Expect bullish momentum. Enter on a retest for targets 50,328 – 50,440.
Avoid impulsive longs at open: Wait for price to consolidate before entering trades.
💡 Pro Tip: If price rejects 50,025, sellers might step in aggressively. Consider buying Put options cautiously.
📊 2️⃣ Flat Opening (±100 points from previous close)
If BANKNIFTY opens near 49,280 - 49,342:
Opening Support/Resistance Zone (49,280 – 49,342): This level will decide the market direction.
Break above 49,400? Expect bullish movement to 49,690. Go long above 49,410 with SL at 49,280.
Break below 49,280? Expect downside movement toward 48,970. Short below 49,250 with SL at 49,350.
💡 Pro Tip: In a flat opening, let price settle before making a decision. Patience pays!
📊 3️⃣ Gap-Down Opening (200+ points below previous close)
If BANKNIFTY opens near 48,970 or below:
48,970 – 49,070 is a strong support: If price holds, expect a bounce back. Go long above 49,000 with SL at 48,900.
Break below 48,970? Next major support is 48,594. Short below 48,950 with SL at 49,050.
If price reaches 48,594 and holds, expect a bounce. Look for buying opportunities around this level.
💡 Pro Tip: In a gap-down, avoid panic trades. Wait for proper confirmation before entering.
⚠️ Risk Management Tips for Options Trading
📌 Never chase a trade. Let price confirm the level before entering.
📌 Use stop-losses strictly. Protect your capital at all times.
📌 Avoid trading in the No Trade Zone. This is where stop-losses get hunted easily.
📌 Monitor IV (Implied Volatility). If IV is high, options premiums might be inflated. Consider spreads instead of naked options.
🔥 Summary & Conclusion
✅ Key Resistance: 49,690 / 50,025 / 50,328 – 50,440
✅ Key Support: 49,280 – 49,342 / 48,970 – 49,070 / 48,594
✅ Gap-Up: Watch resistance at 50,025. Breakout = bullish, rejection = short.
✅ Flat Opening: Wait for breakout/breakdown from Opening Support before entering.
✅ Gap-Down: 48,970 is crucial. Holding = bounce, breakdown = more downside.
🎯 Stick to the plan, follow discipline, and manage your risks!
⚠ Disclaimer: I am NOT a SEBI-registered analyst. This analysis is for educational purposes only. Trade at your own risk.
BANKNIFTY trade ideas

Bank nifty longBanknifty potential first pullback and breakout trade on upside.
Buy on break of 50k. . .for 52k targets.

[INTRADAY] #BANKNIFTY PE & CE Levels(13/02/2025)Today will be slightly gap up opening expected in banknifty. Any bullish rally only expected if banknifty starts trading and sustain above 49550 level. Further downside expected below the 49450 level. This downside can goes upto 49050 and extend next 400-500+ points in case starts trading below 48950 level.

BANK NIFTY S/R for 12/2/25Support and Resistance Levels:
Support Levels: These are price points (green line/shade) where a downward trend may be halted due to a concentration of buying interest. Imagine them as a safety net where buyers step in, preventing further decline.
Resistance Levels: Conversely, resistance levels (red line/shade) are where upward trends might stall due to increased selling interest. They act like a ceiling where sellers come in to push prices down.
Breakouts:
Bullish Breakout: When the price moves above resistance, it often indicates strong buying interest and the potential for a continued uptrend. Traders may view this as a signal to buy or hold.
Bearish Breakout: When the price falls below support, it can signal strong selling interest and the potential for a continued downtrend. Traders might see this as a cue to sell or avoid buying.
20 EMA (Exponential Moving Average):
Above 20 EMA(50 EMA): If the stock price is above the 20 EMA, it suggests a potential uptrend or bullish momentum.
Below 20 EMA: If the stock price is below the 20 EMA, it indicates a potential downtrend or bearish momentum.
Trendline: A trendline is a straight line drawn on a chart to represent the general direction of a data point set.
Uptrend Line: Drawn by connecting the lows in an upward trend. Indicates that the price is moving higher over time. Acts as a support level, where prices tend to bounce upward.
Downtrend Line: Drawn by connecting the highs in a downward trend. Indicates that the price is moving lower over time. It acts as a resistance level, where prices tend to drop.
Disclaimer:
I am not a SEBI registered. The information provided here is for learning purposes only and should not be interpreted as financial advice. Consider the broader market context and consult with a qualified financial advisor before making investment decisions.
BANKNIFTY : Trading Levels and Plan for 13-Feb-2025
🔹 Key Levels:
📌 Resistance: 49,787 / 50,200 / 50,298
📌 Support: 49,216 / 48,943 / 48,900
📌 No Trade Zone: 49,461 - 49,603 (Avoid trading inside this zone)
📊 1️⃣ Gap-Up Opening (200+ points above previous close)
If BANKNIFTY opens above 49,787:
Watch for rejection at 50,200: If price struggles, take a short trade with SL above 50,298. Target: 49,787 – 49,600.
Sustained breakout of 50,200? Expect bullish momentum. Enter on retest for targets 50,298 – 50,450.
Avoid impulsive longs at open: Let price stabilize before entering.
💡 Pro Tip: If price rejects 50,200 after a big gap-up, sellers might take control. Use Put options wisely.
📊 2️⃣ Flat Opening (±50 points from previous close)
If BANKNIFTY opens near 49,500-49,600:
No Trade Zone (49,461 - 49,603) – Avoid trading here. Let price break out.
Break above 49,603? Expect bullish move to 49,787. Go long above 49,605 with SL at 49,450.
Break below 49,461? Expect downside move toward 49,216. Short below 49,460 with SL at 49,550.
💡 Pro Tip: In a flat opening, avoid jumping into trades. Let a clear direction emerge.
📊 3️⃣ Gap-Down Opening (200+ points below previous close)
If BANKNIFTY opens near 49,216 or below:
49,216 as support? If price holds, expect a bounce back. Go long above 49,250 with SL at 49,150.
Break below 49,216? Next major support is 48,943. Short below 49,200 with SL at 49,320.
If price reaches 48,943 and holds, expect a bounce. Look for buying opportunities.
💡 Pro Tip: Be careful with aggressive shorts in a gap-down. Wait for confirmation before entering.
⚠️ Risk Management Tips for Options Trading
📌 Never chase trades. Let price confirm the level before entering.
📌 Use stop losses strictly. No SL = No trading discipline = Losses.
📌 Avoid trading in the No Trade Zone. Wait for clear breakout/breakdown.
📌 If IV (Implied Volatility) is high, premiums might be inflated. Be cautious with buying options.
🔥 Summary & Conclusion
✅ Key Resistance: 49,787 / 50,200 / 50,298
✅ Key Support: 49,216 / 48,943 / 48,900
✅ No Trade Zone: 49,461 - 49,603
✅ Gap-Up: Watch for resistance at 50,200. Breakout = bullish, rejection = short.
✅ Flat Opening: Trade based on breakout/breakdown of No Trade Zone.
✅ Gap-Down: 49,216 is key. Holding = bounce, breakdown = more downside.
🎯 Stick to the plan, be disciplined, and trade wisely!
⚠ Disclaimer: I am NOT a SEBI-registered analyst. This analysis is for educational purposes only. Trade at your own risk.

NIFTY BANK-SIDE WAYS MOVE AND LEVELS TO WATCHNIFTY BANK:Broadly speaking still BNIFTY is not fully out of danger.As of now sideways move with negative bias.The trend is likely to reverse only when BNIFTY holds above 49650-49700 decisively. Incidentally 49650 is its 20 DEMA level,If holds will make an attempt at 50000+.Major support lies at 48900-49000.Close below these levels likely to trigger another 500-1000 points fall(For educational purpose only)

[INTRADAY] #BANKNIFTY PE & CE Levels(12/02/2025)Today will be slightly gap up opening expected in banknifty. Any bullish rally only expected if banknifty starts trading and sustain above 49550 level. Further downside expected below 49450 level this downside rally can be continue upto 49050 level in today's session. If banknifty banknifty starts trading below 48950 in today's session then possible strong downside rally of 400-500+ points upto 48550 level.

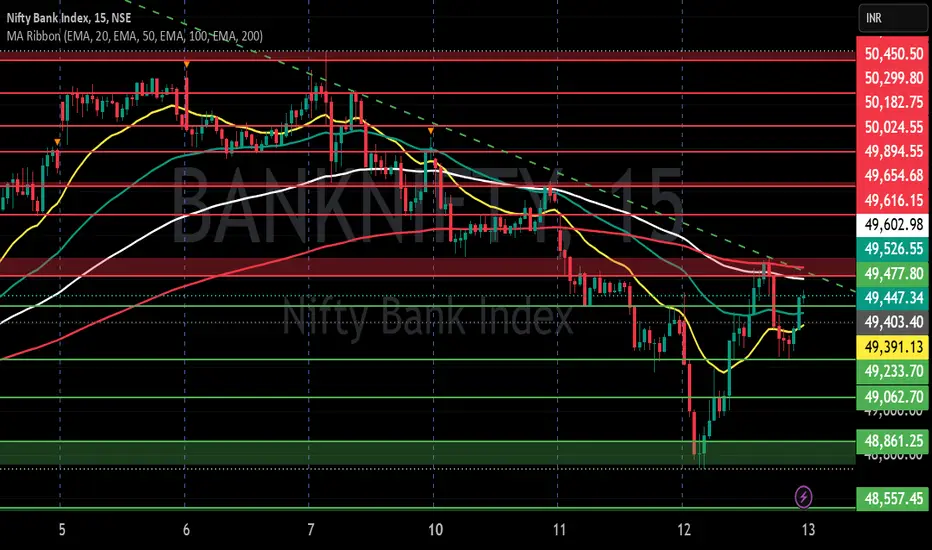
BankNifty Intraday Support & Resistance Levels for 12.02.2025Tuesday’s session saw BankNifty opening negative, making a high of 49,949.75 before experiencing a sharp decline to 49,177.40, entering the 125m Demand Zone (48,906.05 - 49,373.45). It closed at 49,403.40, losing 577 points from the previous close. The Weekly Trend (50 SMA) remains Negative, while the Daily Trend (50 SMA) stays sideways, indicating ongoing market uncertainty.
Demand/Support Zones
Near Demand/Support Zone (125m): 48,906.05 - 49,373.45 (Tested)
Far Demand/Support Zone (15m): 48,511.70 - 48,627.95
Far Demand/Support Zone (125m): 47,981.35 - 48,319.20
Far Support Level: 46,077.85 (Low of 4th June 2024)
Far Demand/Support Zone (Daily): 44,633.85 - 45,750.40
Supply/Resistance Zones
Near Supply/Resistance Zone (15m): 49,949.75 - 50,049.10
Near Supply/Resistance Zone (30m): 50,146.10 - 50,248.35
Far Supply/Resistance Zone (15m): 50,308.70 - 50,462.35
Far Supply/Resistance Zone (Weekly): 50,485.05 - 51,979.75 (Tested)
Far Supply/Resistance Zone (75m): 50,904.35 - 51,088.90 (Inside the Weekly Supply Zone)
Outlook
BankNifty’s close near 49,400 within the tested demand zone suggests that buyers are attempting to hold this level. A break below 48,900 could invite further downside towards 48,500 - 48,300. On the upside, 49,950 - 50,050 remains the immediate resistance, with a breakout above 50,250 needed for bullish momentum.

Assessment of all indexes of NiftyThe **National Stock Exchange (NSE) of India** has a wide range of indices covering different sectors, market caps, and investment themes. As of now, NSE has over **350 indices**, categorized into different groups.
### **Major Index Categories on NSE:**
1. **Benchmark Indices**
- **NIFTY 50** (Top 50 stocks)
- **NIFTY Next 50** (Next 50 after NIFTY 50)
- **NIFTY 100** (NIFTY 50 + NIFTY Next 50)
- **NIFTY 500** (Top 500 companies)
2. **Sectoral Indices**
- **NIFTY Bank**
- **NIFTY IT**
- **NIFTY Pharma**
- **NIFTY FMCG**
- **NIFTY Auto**
- **NIFTY Metal**
- And more covering different industries.
3. **Thematic Indices**
- **NIFTY Infrastructure**
- **NIFTY Energy**
- **NIFTY MNC** (Multinational companies)
- **NIFTY Dividend Opportunities 50**
4. **Strategy Indices**
- **NIFTY Low Volatility 50**
- **NIFTY Alpha 50**
- **NIFTY Quality 30**
5. **Fixed Income & Debt Indices**
- **NIFTY 10 Year Benchmark G-Sec**
- **NIFTY Corporate Bond Index**
6. **Broad Market Indices**
- **NIFTY Midcap 50**
- **NIFTY Smallcap 100**
- **NIFTY Microcap 250**
Would you like details about any specific NSE index?

Bank Nifty Analysis (Study Purpose Only)This chart represents the Bank Nifty Index (1W timeframe), showing a long-term trend with higher highs (HH) and higher lows (HL). The key observations from the chart are:
Uptrend Channel:
The price has been moving within a long-term rising channel (purple lines).
Bank Nifty has consistently formed higher highs (HH) and higher lows (HL), indicating a bullish trend.
Recent Breakdown Sign:
The latest HH shows a potential reversal with a breakdown from a short-term uptrend (yellow line).
If the price fails to sustain above the yellow trendline, a correction toward the lower boundary of the channel is possible.
Potential Correction Targets:
The orange projected path suggests a drop towards the mid/lower range of the channel.
The first major support zone is around 29,500 - 30,000 (lower trendline).
If the channel holds, the long-term uptrend may continue after a correction.
Trend Summary:
✅ Long-term Bullish but currently facing a possible correction phase.
⚠️ Break of support could trigger a deeper retracement toward the lower channel.
Would you like a deeper breakdown of key levels or alternative scenarios?

[INTRADAY] #BANKNIFTY PE & CE Levels(11/02/2025)Slightly gap up opening expected in banknifty near 50000 level. After opening if banknifty starts trading and sustain above 50050 level then expected upside rally upto the 50450 level in opening session. Downside movement possible if banknifty not sustain above level and starts trading below 49950. This downside can goes upto the 49550 level in today's session.

Bank Nifty Projection for This Week **Bank Nifty** (Nifty Bank) is a stock market index on the **National Stock Exchange of India (NSE)** that represents the performance of the banking sector. It consists of the **12 most liquid and large-cap banking stocks** from both **public and private sector banks**. The index serves as a benchmark for banking sector performance and is widely used for trading in futures and options. Major components of Bank Nifty include **HDFC Bank, ICICI Bank, State Bank of India (SBI), Axis Bank, Kotak Mahindra Bank, IndusInd Bank**, and others. The index is highly volatile and sensitive to economic, monetary policy, and banking sector developments.

BankNifty Intraday Support & Resistance Levels for 11.02.2025Monday’s session saw BankNifty opening negative, making an initial high of 50,155.65 before slipping to a day low of 49,703.10. Despite a minor recovery, it closed at 49,981, losing 178 points from the previous close. The Weekly Trend (50 SMA) remains negative, while the Daily Trend (50 SMA) stays sideways, indicating market uncertainty.
Demand/Support Zones
Near Demand/Support Zone (125m): 48,906.05 - 49,373.45
Far Demand/Support Zone (15m): 48,511.70 - 48,627.95
Far Demand/Support Zone (125m): 47,981.35 - 48,319.20
Far Support Level: 46,077.85 (Low of 4th June 2024)
Far Demand/Support Zone (Daily): 44,633.85 - 45,750.40
Supply/Resistance Zones
Near Supply/Resistance Zone (15m): 50,308.70 - 50,462.35
Far Supply/Resistance Zone (Weekly): 50,485.05 - 51,979.75 (Tested)
Far Supply/Resistance Zone (75m): 50,904.35 - 51,088.90 (Inside the Weekly Supply Zone)
Outlook
BankNifty is struggling to maintain key support levels, with 49,700 acting as an important support today. A break below this level could push prices towards 49,40000 - 48,900. On the upside, 50,300 - 50,500 remains a strong resistance zone. A sustained breakout above 50,500 could trigger further upside, while failing to hold above 49,700 may bring increased selling pressure.

BANK NIFTY | SHORT | STBTBANK NIFTY is showing a tendency to correct after the Weekly Pivot got rejected today in the first session of trading.
We can anticipate the price to correct further towards 49,160 levels which should see a good support.

[INTRADAY] #BANKNIFTY PE & CE Levels(10/02/2025)Today will be flat or slightly gap down opening expected in banknifty. After opening if it's sustain above 50050 level then expected upside movement upto 50450 level in opening session. Major downside expected if banknifty starts trading below 49950 level. This downside can goes upto 49550 level after the breakdown. Strong upside rally possible above the 50550 level.

BankNifty Intraday Support & Resistance Levels for 10.02.2025Friday’s session was highly volatile, with BankNifty opening positive and hitting a high of 50,641.75 before a sharp drop to 50,042.30. It rallied again to 50,462.35, but selling pressure pushed it to a day low of 49,871.15, entering the 15-minute Demand Zone. A slight recovery followed, and BankNifty closed at 50,158.85, losing 223 points over the previous close. The Weekly Trend (50 SMA) remains Negative, while the Daily Trend (50 SMA) is sideways.
Demand/Support Zones
Near Demand/Support Zone (125m): 48,906.05 - 49,373.45
Far Demand/Support Zone (15m): 48,511.70 - 48,627.95
Far Demand/Support Zone (125m): 47,981.35 - 48,319.20
Far Support Level: 46,077.85 (Low of 4th June 2024)
Far Demand/Support Zone (Daily): 44,633.85 - 45,750.40
Supply/Resistance Zones
Near Supply/Resistance Zone (15m): 50,308.70 - 50,462.35
Far Supply/Resistance Zone (Weekly): 50,485.05 - 51,979.75 (Tested)
Far Supply/Resistance Zone (75m): 50,904.35 - 51,088.90 (Inside Weekly Supply Zone)
Outlook
BankNifty continues to struggle near 50,500, facing resistance in the 15-minute zone. The weekly supply zone at 50,485 - 51,980 remains a crucial hurdle. On the downside, 49,900 - 49,800 is a key support area. A break above 50,500 could lead to further upside, while a failure to hold 49,800 may push it lower.


BANK NIFTY S/R for 10/2/25Support and Resistance Levels:
Support Levels: These are price points (green line/shade) where a downward trend may be halted due to a concentration of buying interest. Imagine them as a safety net where buyers step in, preventing further decline.
Resistance Levels: Conversely, resistance levels (red line/shade) are where upward trends might stall due to increased selling interest. They act like a ceiling where sellers come in to push prices down.
Breakouts:
Bullish Breakout: When the price moves above resistance, it often indicates strong buying interest and the potential for a continued uptrend. Traders may view this as a signal to buy or hold.
Bearish Breakout: When the price falls below support, it can signal strong selling interest and the potential for a continued downtrend. Traders might see this as a cue to sell or avoid buying.
20 EMA (Exponential Moving Average):
Above 20 EMA(50 EMA): If the stock price is above the 20 EMA, it suggests a potential uptrend or bullish momentum.
Below 20 EMA: If the stock price is below the 20 EMA, it indicates a potential downtrend or bearish momentum.
Trendline: A trendline is a straight line drawn on a chart to represent the general direction of a data point set.
Uptrend Line: Drawn by connecting the lows in an upward trend. Indicates that the price is moving higher over time. Acts as a support level, where prices tend to bounce upward.
Downtrend Line: Drawn by connecting the highs in a downward trend. Indicates that the price is moving lower over time. It acts as a resistance level, where prices tend to drop.
Disclaimer:
I am not a SEBI registered. The information provided here is for learning purposes only and should not be interpreted as financial advice. Consider the broader market context and consult with a qualified financial advisor before making investment decisions.

Short turm trend changeShort term change follow this projection every 15 minute every rise is sell opportunity in 15m supply zone


Banknifty February 2nd week analysis Banknifty is looking dull, upside looks tough. Banknifty can slip up to a range of 48994-49315 if it breaks the support range of 49750-49350. For upside, a base level would be 50427. And if Banknifty successfully crosses and sustains above 50832, then we can expect strong upside up to levels of 51850-52270 in the upcoming week.
Disclaimer-: NOT A BUY/SELL RECOMMENDATION!!!

[INTRADAY] #BANKNIFTY PE & CE Levels(07/02/2025)Today will be slightly gap up opening expected in banknifty. Expected opening near 50450 level. After opening it will face resistance at this level. Any strong bullish rally only expected if banknifty starts trading above 50550+ level. Downside 50050 level will act as a support for today's session. Any major downside expected below the 49950 level.

BankNifty Intraday Support & Resistance Levels for 07.02.2025Thursday’s session saw BankNifty opening with a gap-up, reaching a high of 50,553.35, touching the Weekly Resistance Zone, before pulling back to a low of 50,149.80. It later recovered and closed at 50,382.10, gaining 39 points over the previous close. The Weekly Trend (50 SMA) remains negative, while the Daily Trend (50 SMA) is sideways.
Demand/Support Zones
Near Demand/Support Zone (15m): 49,888.35 - 49,977.05
Near Demand/Support Zone (125m): 48,906.05 - 49,373.45
Far Demand/Support Zone (15m): 48,511.70 - 48,627.95
Far Demand/Support Zone (125m): 47,981.35 - 48,319.20
Far Support Level: 46,077.85 (Low of 4th June 2024)
Far Demand/Support Zone (Daily): 44,633.85 - 45,750.40
Supply/Resistance Zones
Far Supply/Resistance Zone (Weekly): 50,485.05 - 51,979.75 (Tested)
Far Supply/Resistance Zone (75m): 50,904.35 - 51,088.90 (Inside Weekly Supply Zone)
Outlook
BankNifty broke above the Daily Supply Zone but faced resistance at the Weekly Supply Zone, indicating potential selling pressure in the coming sessions. A decisive move above 50,900 - 51,150 could indicate further upside, while failure to hold above 49,800 may lead to weakness.
