BANKNIFTY KEY LEVEL FOR 07/02/2025//@description
// All credit goes to Tony for the concept of this indicator. His Trading View link: www.tradingview.com
// Note: The calculation method in this indicator differs from Tony's, but the concept is derived from his work.
I want to make it clear that I am not a seller, and this method was not taught to me by anyone. The original creator only gave me one clue:
👉 "If you get one level, you get all levels."
Everything else—the way I nail the method and applied it—is my own work. I respect the original idea, but my approach is independent.
Explanation:
This trading system helps you avoid blind trades by providing confirmation for better entries and exits.
Entry/Exit Points:
- Entry/Exit Lines: Use the BLACK line for long trades and the RED line for short trades, based on confirmation from your trading plan.
- Stop Loss: For long trades, set the stop loss at the RED line below. For short trades, set it at the BLACK line above.
- Take Profit: For long trades, target the next RED line above. For short trades, target the next BLACK line below.
Timeframe:
Use a 5 mins timeframe for trading.
Risk Disclaimer:
This setup is for educational purposes. I'm not responsible for your gains or losses. Check the chart for more details.
BANKNIFTY trade ideas

BANK NIFTY S/R for 6/2/25Support and Resistance Levels:
Support Levels: These are price points (green line/shade) where a downward trend may be halted due to a concentration of buying interest. Imagine them as a safety net where buyers step in, preventing further decline.
Resistance Levels: Conversely, resistance levels (red line/shade) are where upward trends might stall due to increased selling interest. They act like a ceiling where sellers come in to push prices down.
Breakouts:
Bullish Breakout: When the price moves above resistance, it often indicates strong buying interest and the potential for a continued uptrend. Traders may view this as a signal to buy or hold.
Bearish Breakout: When the price falls below support, it can signal strong selling interest and the potential for a continued downtrend. Traders might see this as a cue to sell or avoid buying.
20 EMA (Exponential Moving Average):
Above 20 EMA(50 EMA): If the stock price is above the 20 EMA, it suggests a potential uptrend or bullish momentum.
Below 20 EMA: If the stock price is below the 20 EMA, it indicates a potential downtrend or bearish momentum.
Trendline: A trendline is a straight line drawn on a chart to represent the general direction of a data point set.
Uptrend Line: Drawn by connecting the lows in an upward trend. Indicates that the price is moving higher over time. Acts as a support level, where prices tend to bounce upward.
Downtrend Line: Drawn by connecting the highs in a downward trend. Indicates that the price is moving lower over time. It acts as a resistance level, where prices tend to drop.
Disclaimer:
I am not a SEBI registered. The information provided here is for learning purposes only and should not be interpreted as financial advice. Consider the broader market context and consult with a qualified financial advisor before making investment decisions.

[INTRADAY] #BANKNIFTY PE & CE Levels(06/02/2025)Today will be gap up opening in banknifty. After opening expected upside rally upto 50950 level if banknifty starts trading above 50550 level. 50050-50450 level are the consolidation zone for banknifty. Any major downside rally only expected below the 49950 level.


BANKNIFTY KEY LEVEL FOR 06/02/2025**Explanation:**
This trading system helps you avoid blind trades by providing confirmation for better entries and exits.
**Entry/Exit Points:**
- **Entry/Exit Lines:** Use the BLACK line for long trades and the RED line for short trades, based on confirmation from your trading plan.
- **Stop Loss:** For long trades, set the stop loss at the RED line below. For short trades, set it at the BLACK line above.
- **Take Profit:** For long trades, target the next RED line above. For short trades, target the next BLACK line below.
**Timeframe:**
Use a 5 mins timeframe for trading.
**Risk Disclaimer:**
This setup is for educational purposes. I'm not responsible for your gains or losses. Check the chart for more details.

BANKNIFTY : Trading levels and Plan for 06-Feb-2025📌 BANKNIFTY TRADING PLAN – 06-Feb-2025
🔹 Previous Close: 50,299.90
🔹 Important Zones Identified:
🟥 Profit Booking Zone: 50,970 - 51,181
🟧 No Trade Zone / Opening Support: 50,133 - 50,375
🟩 Opening Support Zone: 49,871.00
🟢 Last Intraday Support: 49,503.00
📈 Scenario 1: Gap-Up Opening (Above 200+ Points)
If BANKNIFTY opens with a strong gap-up above 50,500, it will approach the profit booking zone (50,970 - 51,181).
🔹 Bullish Strategy:
If the price sustains above 50,970, we can look for a breakout trade targeting 51,181+.
Ideal entry will be on retracement towards 50,970 with a stop loss below 50,800.
🔻 Bearish Scenario:
If rejection is seen from 51,000 - 51,181, a short trade can be considered with targets back to 50,500 - 50,375.
Stop loss for short trade above 51,250.
📝 Pro Tip: If a gap-up directly reaches the profit booking zone, avoid aggressive long positions. Wait for a breakout or a pullback entry.
📊 Scenario 2: Flat Opening (Between 50,133 - 50,375)
A flat opening within the No Trade Zone (50,133 - 50,375) requires patience and confirmation before entering a trade.
🔹 Bullish Plan:
If the price breaks above 50,375 with strong volume, a long trade can be taken targeting 50,600 - 50,970.
Stop loss to be placed below 50,250.
🔻 Bearish Plan:
If BANKNIFTY breaks below 50,133, expect a move toward 49,871.
Short trade can be initiated with SL above 50,250.
📝 Pro Tip: Flat openings often lead to choppy price action in the first 15-30 minutes. Avoid impulsive trades; let the market establish direction.
📉 Scenario 3: Gap-Down Opening (Below 49,871)
If BANKNIFTY opens below 49,871, it will enter the Opening Support Zone, and we must evaluate price action carefully.
🔹 Buying Opportunity:
A strong bullish reversal from 49,503 - 49,871 can give a long opportunity targeting 50,133 - 50,375.
SL for longs should be below 49,400.
🔻 Breakdown Plan:
If 49,503 breaks, expect further downside toward 49,200-49,000.
Short trades can be taken with SL above 49,600.
📝 Pro Tip: If the market gaps down but quickly recovers above 49,871, it may indicate a trap for sellers—watch for reversal signs.
⚠️ Risk Management & Options Trading Tips
✔ For Option Buyers: Choose strikes near ATM (At-the-Money) to avoid time decay. Enter only when price action confirms.
✔ For Option Sellers: If IV (Implied Volatility) is high, consider selling OTM (Out-of-the-Money) options at key resistance/support levels.
✔ Always use SL: Protect capital! A good R:R (Risk-to-Reward) ratio ensures long-term success.
✔ Avoid Overtrading: Stick to planned trades—don’t force setups.
📌 Summary & Conclusion
🚀 Bullish above: 50,375 (Target 50,970+)
📉 Bearish below: 50,133 (Target 49,871-49,503)
⚠️ Watch Key Zones: No Trade Zone & Profit Booking Area
📊 Expect Volatility: Let the first 15-30 min settle before aggressive trades.
⚠️ Disclaimer: I am not a SEBI-registered analyst. This analysis is for educational purposes only. Always do your own research before taking any trades. 📢📊
#BANKNIFTY #TradingPlan #StockMarket #OptionsTrading 🚀

[INTRADAY] #BANKNIFTY PE & CE Levels(05/02/2025)Today expected gap up opening in banknifty. After opening if banknifty starts trading above 50550 level then expected further upside rally of 400-500+ points in today's session. Downside 50050 level act as a important support for today's session. Any major downside rally only expected below the 49950 level.

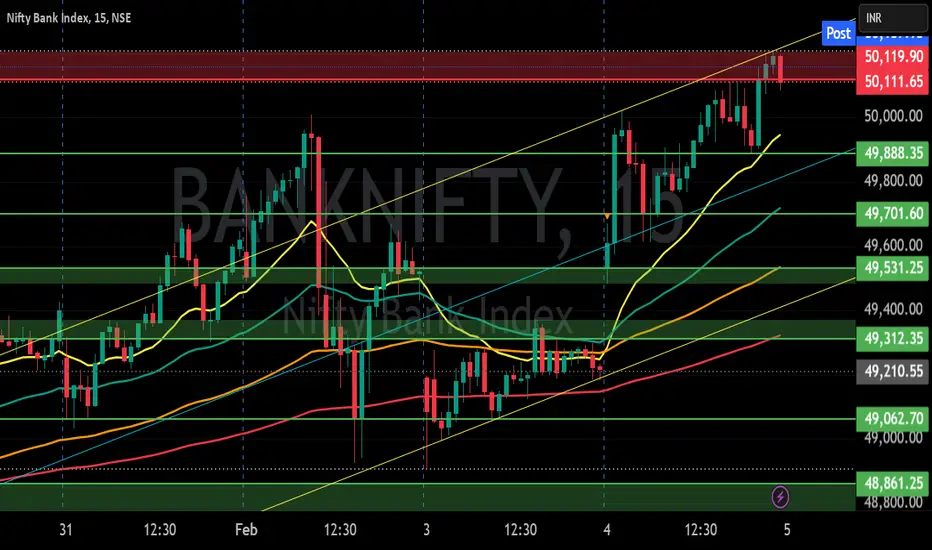
BankNifty Intraday Support & Resistance Levels for 05.02.2025Tuesday’s session saw a strong rally in BankNifty, opening with a 328-point gap-up at 49,538.80, dipping slightly to a low of 49,482.50, and then surging to a high of 50,206.60. It closed at 50,157.95, gaining 947 points over the previous close. The Weekly Trend (50 SMA) remains Negative, while the Daily Trend (50 SMA) is sideways.
Demand/Support Zones
Near Demand/Support Zone (15m): 49,888.35 - 49,977.05
Far Demand/Support Zone (15m): 48,511.70 - 48,627.95
Far Demand/Support Zone (125m): 47,981.35 - 48,319.20
Far Support Level: 46,077.85 (Low of 4th June 2024)
Far Demand/Support Zone (Daily): 44,633.85 - 45,750.40
Supply/Resistance Zones
Near Supply/Resistance Zone (Daily): 49,230.15 - 50,447.60 (Tested multiple times, current price inside the zone)
Far Supply/Resistance Zone (Weekly): 50,485.05 - 51,979.75
Far Supply/Resistance Zone (75m): 50,904.35 - 51,088.90 (Inside the weekly supply zone)
Outlook
BankNifty’s strong recovery brought it inside the Daily Supply Zone, but it still needs to sustain above 50,450 for further upside. The Weekly Trend remains negative, so watch for reactions at key resistance zones. If the momentum continues, the next major hurdle is at Weekly Supply Zone.

BANKNIFTY KEY LEVEL FOR 05/04/2025**Explanation:**
This trading system helps you avoid blind trades by providing confirmation for better entries and exits.
**Entry/Exit Points:**
- **Entry/Exit Lines:** Use the BLACK line for long trades and the RED line for short trades, based on confirmation from your trading plan.
- **Stop Loss:** For long trades, set the stop loss at the RED line below. For short trades, set it at the BLACK line above.
- **Take Profit:** For long trades, target the next RED line above. For short trades, target the next BLACK line below.
**Timeframe:**
Use a 5 mins timeframe for trading.
**Risk Disclaimer:**
This setup is for educational purposes. I'm not responsible for your gains or losses. Check the chart for more details.

BANKNIFTY - Trading plan and levels for 05-Feb-2025📌 Bank Nifty Trading Plan – 05-Feb-2025
📊 Market Overview & Key Levels
Previous Close: 50,111.65
Resistance for Sideways: 50,310-50,374
Profit Booking Zone: 50,970
Opening Support / Resistance Zone: 50,147-50,310
Opening Support: 49,875-49,866
Last Intraday Support: 49,550
📈 Opening Scenarios & Trading Plan
🟢 Scenario 1: Gap-Up Opening (📈 200+ points)
If Bank Nifty opens above 50,310-50,374, it enters a resistance zone.
A strong hourly close above 50,374 can trigger a bullish move toward 50,600-50,970.
However, if prices struggle to hold above this zone, expect a pullback towards 50,147-50,310 before further movement.
📌 Trading Plan:
Wait for price confirmation near 50,374 before going long.
A rejection from resistance (candlestick reversal patterns like shooting star or bearish engulfing) could trigger a short trade toward 50,147.
Stop loss should be placed above 50,400 for shorts and below 50,250 for longs.
🔽🔽🔽
🟠 Scenario 2: Flat Opening (📊 ±100 points from previous close)
If Bank Nifty opens within 50,100-50,200, expect range-bound movement in the first 30 minutes.
A breakout above 50,310 confirms a bullish trend, while a breakdown below 50,100 indicates weakness.
📌 Trading Plan:
For a breakout above 50,310, enter longs with a target of 50,600-50,970.
For a breakdown below 50,100, short with a target of 49,866-49,550.
Wait for confirmation on 15-min candle close before entering trades.
🔽🔽🔽
🔴 Scenario 3: Gap-Down Opening (📉 200+ points)
If Bank Nifty opens below 49,875, it enters a strong support zone.
A further breakdown below 49,550 can accelerate selling pressure toward 49,300-49,200.
📌 Trading Plan:
If price stabilizes above 49,866, consider a bounce trade for quick scalping toward 50,100.
A break below 49,550 confirms further weakness – enter shorts targeting 49,300.
Keep SL above 49,950 for shorts and below 49,500 for longs.
📌 Risk Management Tips for Options Trading 🎯
✅ Use Stop Losses Based on Hourly Close: Avoid emotional exits, always base SL decisions on market structure.
✅ Avoid Trading in No-Trend Zones: If price is stuck in the 50,147-50,310 range, wait for a breakout confirmation.
✅ For Option Buyers: IV crush can affect premiums, prefer ATM/ITM options for better movement.
✅ For Option Sellers: Use hedging strategies like spreads to limit risk.
📊 Summary & Conclusion
Bullish Confirmation: Above 50,374, targeting 50,600-50,970.
Bearish Confirmation: Below 49,875, with potential downside toward 49,550-49,300.
Sideways Range: Between 50,147-50,310, avoid unnecessary trades.
Watch Price Action for Breakouts & Rejections before entering trades.
📢 Disclaimer
I am not a SEBI-registered analyst. This analysis is for educational purposes only. Please conduct your own research or consult with a financial advisor before making any trading decisions.

BANK NIFTY S/R for 5/2/25Support and Resistance Levels:
Support Levels: These are price points (green line/shade) where a downward trend may be halted due to a concentration of buying interest. Imagine them as a safety net where buyers step in, preventing further decline.
Resistance Levels: Conversely, resistance levels (red line/shade) are where upward trends might stall due to increased selling interest. They act like a ceiling where sellers come in to push prices down.
Breakouts:
Bullish Breakout: When the price moves above resistance, it often indicates strong buying interest and the potential for a continued uptrend. Traders may view this as a signal to buy or hold.
Bearish Breakout: When the price falls below support, it can signal strong selling interest and the potential for a continued downtrend. Traders might see this as a cue to sell or avoid buying.
20 EMA (Exponential Moving Average):
Above 20 EMA(50 EMA): If the stock price is above the 20 EMA, it suggests a potential uptrend or bullish momentum.
Below 20 EMA: If the stock price is below the 20 EMA, it indicates a potential downtrend or bearish momentum.
Trendline: A trendline is a straight line drawn on a chart to represent the general direction of a data point set.
Uptrend Line: Drawn by connecting the lows in an upward trend. Indicates that the price is moving higher over time. Acts as a support level, where prices tend to bounce upward.
Downtrend Line: Drawn by connecting the highs in a downward trend. Indicates that the price is moving lower over time. It acts as a resistance level, where prices tend to drop.
Disclaimer:
I am not a SEBI registered. The information provided here is for learning purposes only and should not be interpreted as financial advice. Consider the broader market context and consult with a qualified financial advisor before making investment decisions.
BANK NIFTY S/R for 4/2/25Support and Resistance Levels:
Support Levels: These are price points (green line/shade) where a downward trend may be halted due to a concentration of buying interest. Imagine them as a safety net where buyers step in, preventing further decline.
Resistance Levels: Conversely, resistance levels (red line/shade) are where upward trends might stall due to increased selling interest. They act like a ceiling where sellers come in to push prices down.
Breakouts:
Bullish Breakout: When the price moves above resistance, it often indicates strong buying interest and the potential for a continued uptrend. Traders may view this as a signal to buy or hold.
Bearish Breakout: When the price falls below support, it can signal strong selling interest and the potential for a continued downtrend. Traders might see this as a cue to sell or avoid buying.
20 EMA (Exponential Moving Average):
Above 20 EMA(50 EMA): If the stock price is above the 20 EMA, it suggests a potential uptrend or bullish momentum.
Below 20 EMA: If the stock price is below the 20 EMA, it indicates a potential downtrend or bearish momentum.
Trendline: A trendline is a straight line drawn on a chart to represent the general direction of a data point set.
Uptrend Line: Drawn by connecting the lows in an upward trend. Indicates that the price is moving higher over time. Acts as a support level, where prices tend to bounce upward.
Downtrend Line: Drawn by connecting the highs in a downward trend. Indicates that the price is moving lower over time. It acts as a resistance level, where prices tend to drop.
Disclaimer:
I am not a SEBI registered. The information provided here is for learning purposes only and should not be interpreted as financial advice. Consider the broader market context and consult with a qualified financial advisor before making investment decisions.

[INTRADAY] #BANKNIFTY PE & CE Levels(04/02/2025)Today will be slightly gap up opening expected in banknifty. Expected opening near 49450 level. After opening it will face resistance at this level and expected reversal towards the downside. Major upside rally only expected if banknifty starts trading and sustain above 49550 level. Downside 49050 will act as a important support for today's session.

BANKNIFTY - Trading levels and Plan for 04-Feb-2025📌 BANKNIFTY Trading Plan for 04-Feb-2025
📍 Key Levels to Watch
Resistance for sideways movement: 50,135
Last Intraday Resistance: 49,772 - 49,866
Opening Resistance: 49,458
Opening Support at retracement: 49,007 - 49,140
Last Intraday Support: 48,782
Buyer's Support Zone (Must Try Zone): 48,580 - 48,471
🚀 If BANKNIFTY Opens with a Gap-Up (200+ Points)
A gap-up opening near 49,600+ means price will be closer to the resistance zone. In this case:
If BANKNIFTY faces rejection near 49,772 - 49,866, look for a shorting opportunity with a target of 49,458, followed by 49,140 if weakness continues.
A strong breakout above 49,866 with volume can push BANKNIFTY towards 50,135.
If BANKNIFTY consolidates around 49,750-49,850 and holds, look for buying opportunities after a retest with a stop-loss below 49,700.
📌 Pro Tip: In a gap-up, option premiums rise due to IV (Implied Volatility). Avoid buying options immediately at the open. Wait for a retracement before entering trades.
📊 If BANKNIFTY Opens Flat (± 50 Points)
A flat opening means price will likely be inside the Opening Support Zone (49,007 - 49,140). This area can act as both support and resistance.
Avoid aggressive trades in this zone. Let the price confirm a breakout or breakdown.
A breakout above 49,140 can push BANKNIFTY towards 49,458, followed by 49,772.
A breakdown below 49,007 can lead to 48,782 first and then towards 48,580.
📌 Pro Tip: When markets open flat, premiums in options decay fast. Use Spreads instead of naked calls/puts to minimize theta decay impact.
📉 If BANKNIFTY Opens with a Gap-Down (200+ Points)
A gap-down near 48,782 - 48,580 can bring initial buying support. However, if this level breaks, we can see a quick move towards 48,471.
If BANKNIFTY finds support around 48,580 and reverses, we can go long with a target of 49,007.
If it struggles near 49,007, this can be a sell-on-rise opportunity for a downward move.
📌 Pro Tip: For put buyers, ensure there is confirmation of weakness before entering. If the market shows strength after the gap-down, avoid holding puts for too long.
📌 Risk Management & Option Trading Tips 🛡️
✅ Use Stop Losses Strictly – Markets can be volatile, and a fixed SL helps in capital protection.
✅ Avoid Trading Inside Choppy Zones – Let the price break out clearly before taking positions.
✅ Use Option Strategies – Consider Spreads or Iron Condors to minimize risk in uncertain conditions.
✅ Watch for Fake Breakouts – If a breakout lacks volume, be cautious of reversals.
📌 Summary & Conclusion 📢
🔹 Bullish Above: 49,140, targeting 49,458 → 49,772.
🔹 Bearish Below: 49,007, targeting 48,782 → 48,580.
🔹 No Trade Zone: 49,007 - 49,140 (Wait for confirmation before trading).
🎯 Follow the plan, manage risk effectively, and trade with discipline.
⚠️ Disclaimer: I am NOT a SEBI registered analyst. This is for educational purposes only. Trade at your own risk.
This trading plan ensures structured decision-making across all scenarios. Let me know if you need modifications! 🚀📊

BANKNIFTY KEY LEVELS FOR 04-02-2025**Explanation:**
This trading system helps you avoid blind trades by providing confirmation for better entries and exits.
**Entry/Exit Points:**
- **Entry/Exit Lines:** Use the BLACK line for long trades and the RED line for short trades, based on confirmation from your trading plan.
- **Stop Loss:** For long trades, set the stop loss at the RED line below. For short trades, set it at the BLACK line above.
- **Take Profit:** For long trades, target the next RED line above. For short trades, target the next BLACK line below.
**Timeframe:**
Use a 5 mins timeframe for trading.
**Risk Disclaimer:**
This setup is for educational purposes. I'm not responsible for your gains or losses. Check the chart for more details.

Long trade for banknifty Add a long trade for banknifty with 150 points sl nd a target of 450-490 points. , easy move possible on upside

[INTRADAY] #BANKNIFTY PE & CE Levels(03/02/2025)Today will be gap down opening in banknifty. After opening if banknifty starts trading below 49450 level then possible downside target upto 49050 level in opening session. This downside rally can be extend for further 400-500+ points in case banknifty gives breakdown of 49000 level and starts below 48950 level. Any strong upside rally only expected if banknifty starts trading and sustain above 49550 level.

BANKNIFTY BUY ANALYSIS DOUBLE BOTTOM PATTERNHere on Banknifty price form a double bottom pattern and now try to go up as the line 49733.15 has broken so trader should go for long with expect profit target of 50557.40 and 51381.60 . Use money management

BANKNIFTY : Trading levels and plan for 03-Feb-2025📈 BANKNIFTY Trading Plan for 03-Feb-2025 📉
Key Levels to Watch:
Resistance Zones:
🔴 Last Intraday Resistance: 49,966 - 50,137
🔴 Opening Resistance: 49,778
🔴 Major Resistance for Sideways Market: 50,378
Support Zones:
🟠 Opening Support/Resistance Zone (Sideways): 49,296 - 49,466
🟢 Last Intraday Support: 49,082
🟢 Major Support Zone: 48,723
🟢 GAP-UP Opening (200+ Points) (Typically above 49,720 region)
➡️ If BANKNIFTY opens above 49,778 and sustains, we need to observe price action at 49,966-50,137 (last intraday resistance zone).
Bullish Scenario: If price consolidates above 50,137 and breaks out with volume, expect a rally towards 50,378+ levels. 📈
📌 Entry: Above 50,137🎯 Target: 50,300-50,378❌ Stop Loss: Below 49,950
Bearish Rejection: If price rejects from 50,137 and fails to sustain, expect a pullback towards 49,778 .
📌 Entry: Below 50,000 after confirmation🎯 Target: 49,800-49,720❌ Stop Loss: Above 50,150
📝 Educational Tip: In strong gap-up scenarios, avoid chasing the market immediately. Let the price consolidate near key resistance levels before taking a trade.
↔️ Sideways Possibility: If BANKNIFTY stays between 49,778 - 50,137 , it may remain range-bound. Wait for a breakout.
⚖️ FLAT Opening (Near 49,500 - 49,600)
➡️ A flat opening would indicate market indecision and a need for further confirmation.
Bullish Bias: If price takes support at 49,466 - 49,500 and starts moving up, it can retest 49,778 , then 49,966 .
📌 Entry: Above 49,600 after bullish confirmation🎯 Target: 49,778 - 49,966❌ Stop Loss: Below 49,450
Bearish Breakdown: If BANKNIFTY breaks below 49,466 , expect a move towards 49,296 or even 49,082 (last intraday support).
📌 Entry: Below 49,466🎯 Target: 49,300 - 49,082❌ Stop Loss: Above 49,550
📝 Educational Tip: Flat openings require patience. Let the market establish a clear direction before entering. Avoid overtrading in a choppy market.
🔴 GAP-DOWN Opening (200+ Points) (Typically below 49,300 )
➡️ If BANKNIFTY opens below 49,296 , it indicates weakness and possible downside towards 49,082 and 48,723 .
Bearish Continuation: If price sustains below 49,296 , expect selling pressure towards 49,082 and 48,723 .
📌 Entry: Below 49,296🎯 Target: 49,082 - 48,723❌ Stop Loss: Above 49,400
Bounce Back Scenario: If BANKNIFTY takes support at 49,082 and shows strong reversal, we may see a move back towards 49,300 or even 49,466 .
📌 Entry: Above 49,100 after confirmation🎯 Target: 49,296 - 49,466❌ Stop Loss: Below 49,000
📝 Educational Tip: In gap-down scenarios, watch for institutional buying or aggressive selling. Avoid counter-trend trades without confirmation.
📌 Risk Management Tips for Options Traders
✅ Trade with Defined Risk: Always set a stop loss before entering a trade.
✅ Avoid Overleveraging: Keep position sizes within your risk tolerance.
✅ Watch for Volatility: Sudden spikes in IV (Implied Volatility) can impact options pricing.
✅ Exit at Key Levels: If a trade reaches resistance/support, book partial profits.
✅ Use Spreads for Safety: Instead of naked options, consider spreads to minimize risk.
📊 Summary & Conclusion Gap-Up: Watch for resistance at 50,137 ; breakout targets 50,378 . Flat Opening: Key support at 49,466 ; break above 49,600 can lead to bullish movement. Gap-Down: Below 49,296 , expect 49,082 - 48,723 ; bounce possible from support.
🛑 Disclaimer: I am not a SEBI-registered analyst. This analysis is for educational purposes only. Trade at your own risk.
🚀 Happy Trading & Stay Disciplined! 💰

BankNifty Intraday Support & Resistance Levels for 03.02.2025Saturday’s special trading session saw BankNifty opening flat, rallying to a day high of 50,009.50, and then witnessing a sharp drop to 48,925.45. It later recovered slightly and closed at 49,506.95, losing 80 points from the previous close. The Weekly Trend (50 SMA) remains Negative, while the Daily Trend (50 SMA) is sideways, indicating a cautious market.
Demand/Support Zones
Near Demand/Support Zone (15m): 48,511.70 - 48,627.95
Far Demand/Support Zone (125m): 47,981.35 - 48,319.20
Far Support Level: 46,077.85 (Low from 4th June 2024)
Far Demand/Support Zone (Daily): 44,633.85 - 45,750.40
Supply/Resistance Zones
Near Supply/Resistance Zone (Daily): 49,230.15 - 50,447.60 (Tested multiple times, current price inside the zone)
Far Supply/Resistance Zone (Weekly): 50,485.05 - 51,979.75
Far Supply/Resistance Zone (75m): 50,904.35 - 51,088.90 (Inside the Weekly Supply Zone)
Outlook
With BankNifty trading within a key resistance zone, a breakout above 50,447 could lead to further upside, while a failure to sustain may result in a retest of lower support zones. The broader trend remains weak, so stay cautious.

BankNifty // Weekly Levels for upcoming days/ weekswww.tradingview.com
Banknifty levels for upcoming weeks. From my own research, it can fall even from 52100 level. So, we can think of bullishness only if it crosses 52200 and sustain above.
Rest all levels are mentioned in chart here

banknifty sellbanknifty elliot wave analysis daily time period . corrective bounce upside and again down .

BANKNIFTY FEBRUARY 1st WEEK ANALYSISNifty Bank is looking uncertain for the upcoming week. We can expect it to remain volatile . We need to be cautious while chasing upside as 49887 is still a resistance for Bank Nifty. Up on crossing and sustaining above 49887, we can expect some short covering up to levels of 52150-52475. Upon breach of 48829, we can expect Bank Nifty to slip on the downside, up to the imp range of 48800-47890++. All levels are marked in the chart posted.
