[INTRADAY] #BANKNIFTY PE & CE Levels(04/07/2025)Bank Nifty will open with a gap-up near the 56950 zone, placing it close to an immediate resistance area. If the index sustains above the 57050–57100 level, it indicates bullish strength and could trigger a further upward move toward 57250, 57350, and potentially 57450+. This level acts as a breakout zone for upside momentum. On the other hand, if the price faces resistance around 56950–57000 and starts reversing, a short opportunity opens below 56950–56900, with targets placed at 56750, 56650, and 56550.
In case Bank Nifty falls further and breaches the 56450 mark, it may signal a strong breakdown and continuation of the downtrend, leading to lower targets around 56250, 56150, and 56050. However, if the index takes support at the 56650–56600 zone and shows signs of reversal, it can provide a buying opportunity for a bounce back toward 56750, 56850, and 56950.
Overall, the day’s strategy should be reactive to these key levels, with trades initiated only upon proper price action confirmation. Use trailing stop-loss to protect profits and exit partially at key target levels.
BANKNIFTY trade ideas

bank nifty cashtime wise from 2 to 3rd wave top appear wave 4 yet not complete in irregular correction,
Alternatively we may be in wave 5 first wave let see Monday clear more picture , though some people started giving target of 59000+, if so this is wave 1 and still one correction due as bearish divergence also emergins in hourly charts. Thanz just a learner may be wrong and not a sebi registered RA.Thanz

Banknifty July 1st Week AnalysisNifty bank is looking positive for the week ahead and we can expect momentum to extend upto 58500-950 in the upcoming week. The important level to watch for upside momentum is 57800. Upon crossing and sustaining above 57800, we can expect upside momentum. On the downside, if Banknifty breaches 57200 and 57000, then we can expect a small retracement upto 56500-350.
ALL LEVELS ARE MARKED IN THE CHART POSTED .

[INTRADAY] #BANKNIFTY PE & CE Levels(26/06/2025)Today, Bank Nifty is likely to open slightly gap up near the 56,550–56,600 zone, which is a crucial resistance area. A sustained move above this zone can trigger bullish momentum, opening the door for further upside targets of 56,750, 56,850, and potentially 56,950+. Traders can look for buying opportunities in call options above this range with a tight stop-loss, especially if the index breaks out with strong volume and positive sentiment. The zone between 56,600 and 56,950 has acted as a resistance band in recent sessions, so a clean breakout may lead to a directional rally.
On the flip side, if Bank Nifty fails to hold above the 56,450 mark and starts to trade below it, we may see downside pressure in the market. This breakdown could offer a good short opportunity using put options, with downside targets around 56,250, 56,150, and 56,050. The 56,050 level will act as a strong support and could attract buyers again if tested. Traders should remain cautious near resistance and support zones and avoid aggressive positions unless there is clear confirmation. The market may remain volatile in the first half, so a wait-and-watch approach with disciplined risk management is advisable.

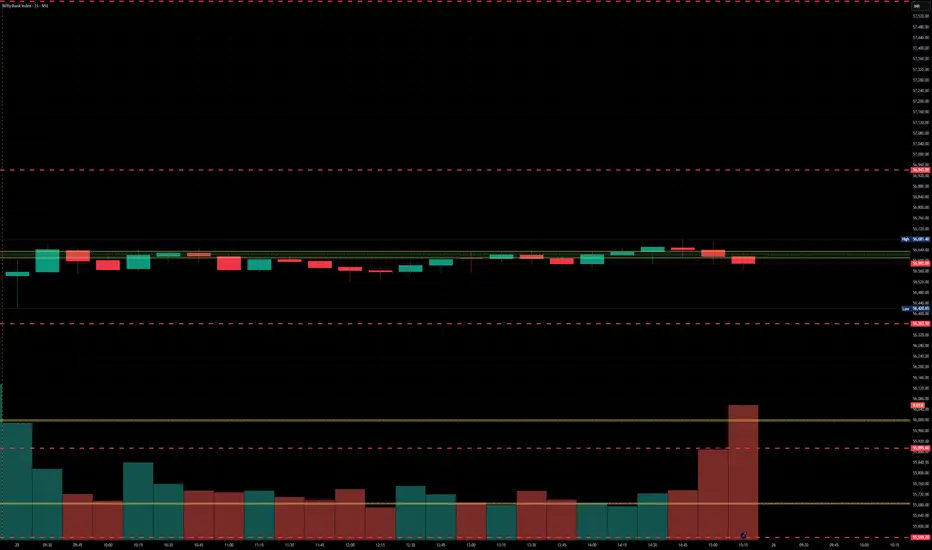
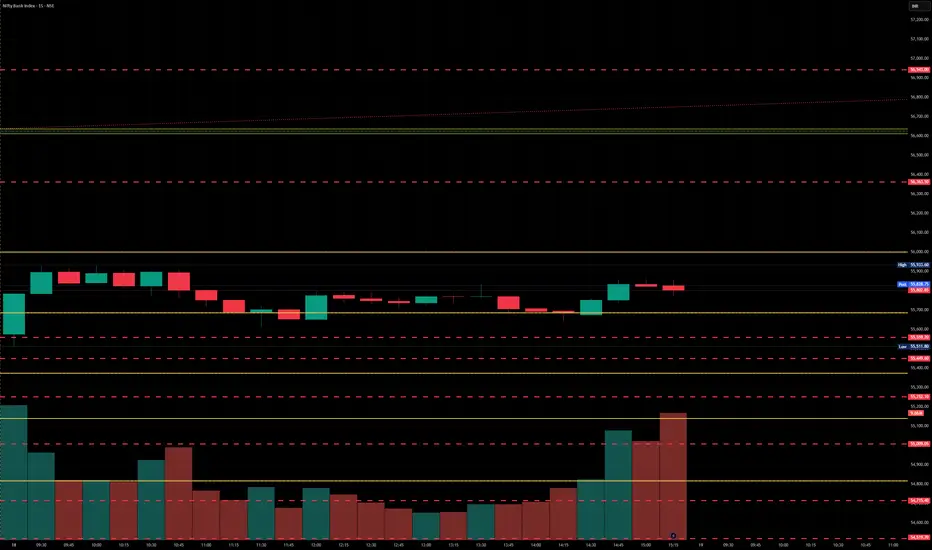
BankNifty levels - Jun 26, 2025Utilizing the support and resistance levels of BankNifty, along with the 5-minute timeframe candlesticks and VWAP, can enhance the precision of trade entries and exits on or near these levels. It is crucial to recognize that these levels are not static, and they undergo alterations as market dynamics evolve.
The dashed lines on the chart indicate the reaction levels, serving as additional points of significance. Furthermore, take note of the response at the levels of the High, Low, and Close values from the day prior.
We trust that this information proves valuable to you.
* If you found the idea appealing, kindly tap the Boost icon located below the chart. We encourage you to share your thoughts and comments regarding it.
Wishing you successful trading endeavors!
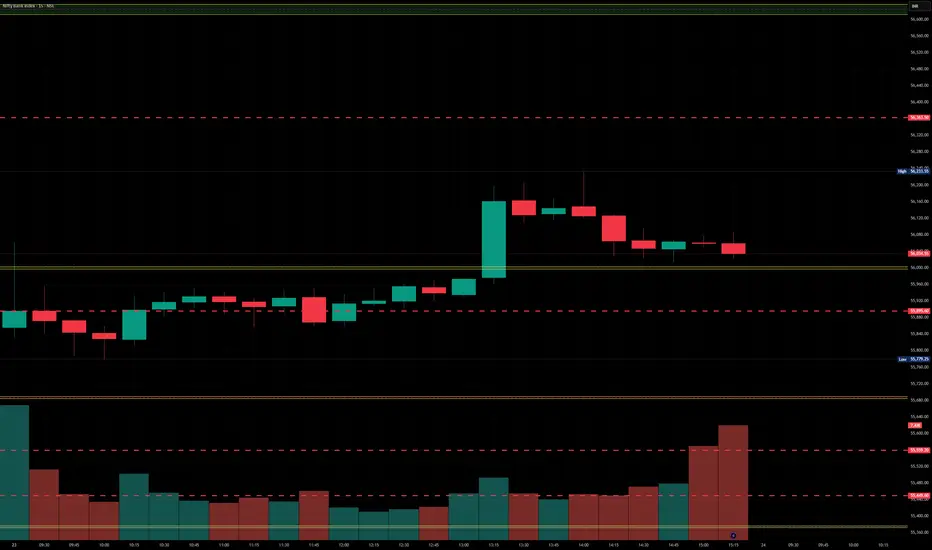
BankNifty levels - Jun 25, 2025Utilizing the support and resistance levels of BankNifty, along with the 5-minute timeframe candlesticks and VWAP, can enhance the precision of trade entries and exits on or near these levels. It is crucial to recognize that these levels are not static, and they undergo alterations as market dynamics evolve.
The dashed lines on the chart indicate the reaction levels, serving as additional points of significance. Furthermore, take note of the response at the levels of the High, Low, and Close values from the day prior.
We trust that this information proves valuable to you.
* If you found the idea appealing, kindly tap the Boost icon located below the chart. We encourage you to share your thoughts and comments regarding it.
Wishing you successful trading endeavors!

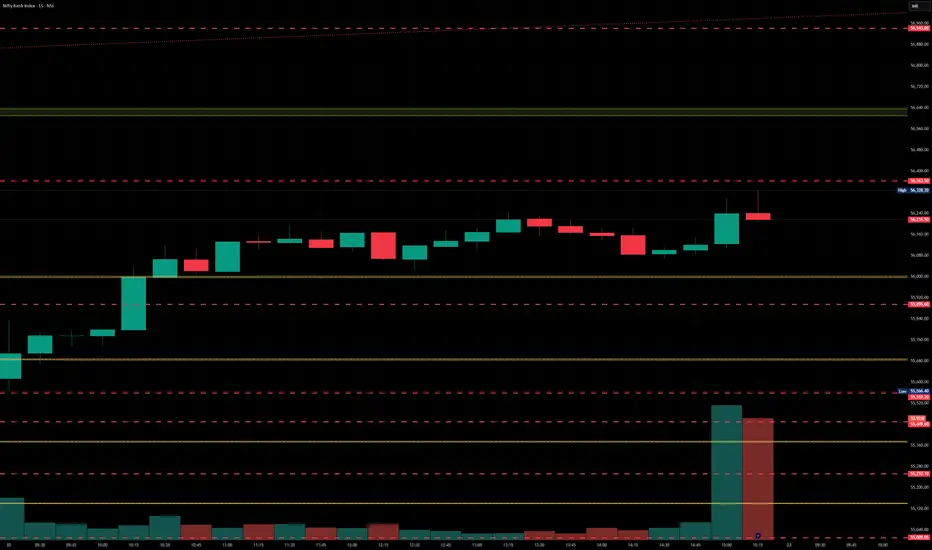
BankNifty levels - Jun 24, 2025Utilizing the support and resistance levels of BankNifty, along with the 5-minute timeframe candlesticks and VWAP, can enhance the precision of trade entries and exits on or near these levels. It is crucial to recognize that these levels are not static, and they undergo alterations as market dynamics evolve.
The dashed lines on the chart indicate the reaction levels, serving as additional points of significance. Furthermore, take note of the response at the levels of the High, Low, and Close values from the day prior.
We trust that this information proves valuable to you.
* If you found the idea appealing, kindly tap the Boost icon located below the chart. We encourage you to share your thoughts and comments regarding it.
Wishing you successful trading endeavors!
#Banknifty directions and levels for June 23:Current View
The current view suggests that if the market sustains the initial gap-down and consolidates, we can expect the correction to continue.
In this case, even if there is a solid pullback, the market may not move much higher.
This would mean it could consolidate between the previous day’s high and the upcoming low.
Alternate View
The alternate view suggests that if the market takes a pullback initially, it may consolidate within the previous day's range.
If it breaks the previous high after that, we can expect further rally continuation, possibly in a diagonal pattern.

[INTRADAY] #BANKNIFTY PE & CE Levels(23/06/2025)A flat opening is expected in Bank Nifty today. After the open, if Bank Nifty sustains above 56,050, an upside rally is likely toward 56,450+. A further continuation of this rally could occur if the index trades above 56,550–56,600, with extended targets up to 56,750 → 56,850 → 56,950+.
On the downside, if Bank Nifty trades below 55,950, some selling pressure may emerge. However, 55,550 will act as strong support for today’s session. A major downward move is only expected if this support breaks, opening potential targets of 55,250 → 55,150 → 55,050-.

Bank Nifty Weekly Insights: Key Levels & TrendsBank Nifty ended the week at 56,252.85 with a gain of 1.31%
Key Levels for the Upcoming Week
🔹 Price Action Pivot Zone:
The critical range to monitor for potential trend reversals or continuation is 56,135 to 56,372
🔹 Support & Resistance Levels:
Support Levels:
S1: 55,781
S2: 55,308
S3: 54,726
Resistance Levels:
R1: 56,729
R2: 57,206
R3: 57,786
Market Outlook
✅ Bullish Scenario: A sustained move above 56,372 could trigger buying momentum, potentially driving Bank Nifty towards R1 (56,729) and beyond.
❌ Bearish Scenario: If the index falls below 56,135, selling pressure may increase, pulling it towards S1 (56,729) and lower levels.
Disclaimer: lnkd.in

Banknifty June 4th Week Analysis Banknifty closing is looking positive, and we can expect upside momentum to continue up to 56600. Upon crossing 56600, we can expect a bigger upside momentum up to a new all-time high of 57267-57500. But if due to any global factors we encounter a bearish move, then imp levels on the downside would be 55770-55300.

BankNifty levels - Jun 23, 2025Utilizing the support and resistance levels of BankNifty, along with the 5-minute timeframe candlesticks and VWAP, can enhance the precision of trade entries and exits on or near these levels. It is crucial to recognize that these levels are not static, and they undergo alterations as market dynamics evolve.
The dashed lines on the chart indicate the reaction levels, serving as additional points of significance. Furthermore, take note of the response at the levels of the High, Low, and Close values from the day prior.
We trust that this information proves valuable to you.
* If you found the idea appealing, kindly tap the Boost icon located below the chart. We encourage you to share your thoughts and comments regarding it.
Wishing you successful trading endeavors!
[INTRADAY] #BANKNIFTY PE & CE Levels(20/06/2025)Today, a flat opening is expected in Bank Nifty, with price action likely to begin around 55,500 levels. There are no major changes in the key levels compared to yesterday, and the market has remained in a consolidation phase.
🔽 If Bank Nifty starts trading below 55,450, it may trigger further downside toward 55,250 → 55,150 → 55,050-. This zone has acted as intraday support recently.
🔼 On the other hand, a move above 55,550–55600 may lead to upward momentum toward 55,750 → 55,850 → 55,950+. A breakout above 56,050 could open the path toward 56,250 → 56,350 → 56,450+.
⚠️ Key Takeaways:
Consolidation continues, so avoid aggressive positions until a breakout occurs.
Watch for range breakouts above 56,050 or below 55,450 for directional moves.
Use tight stop-losses and trail profits smartly to protect against volatility spikes.

BankNifty levels - Jun 20, 2025Utilizing the support and resistance levels of BankNifty, along with the 5-minute timeframe candlesticks and VWAP, can enhance the precision of trade entries and exits on or near these levels. It is crucial to recognize that these levels are not static, and they undergo alterations as market dynamics evolve.
The dashed lines on the chart indicate the reaction levels, serving as additional points of significance. Furthermore, take note of the response at the levels of the High, Low, and Close values from the day prior.
We trust that this information proves valuable to you.
* If you found the idea appealing, kindly tap the Boost icon located below the chart. We encourage you to share your thoughts and comments regarding it.
Wishing you successful trading endeavors!

[INTRADAY] #BANKNIFTY PE & CE Levels(19/06/2025)Today, a flat opening is expected in Bank Nifty near the 55,800 zone. The index has been moving within a defined range for the past few sessions, and there are no major changes in yesterday’s key levels.
🔼 If Bank Nifty sustains above 55,550–55,600, it may show bullish momentum toward 55,750 → 55,850 → 55,950+. A breakout above 56,050 could lead to further upside toward 56,250 → 56,350 → 56,450+.
🔽 However, if the index fails to hold above 55,900–55,950 and starts reversing, a short opportunity may arise toward 55,750 → 55,650 → 55,550-. Sustained selling below 55,450 can drag the index down to 55,250 → 55,150 → 55,050-.
⚠️ Note:
The market is still in a consolidation phase, so false breakouts are possible. Stick to levels, wait for confirmation, and use strict stop-losses with trailing targets to manage risk effectively.

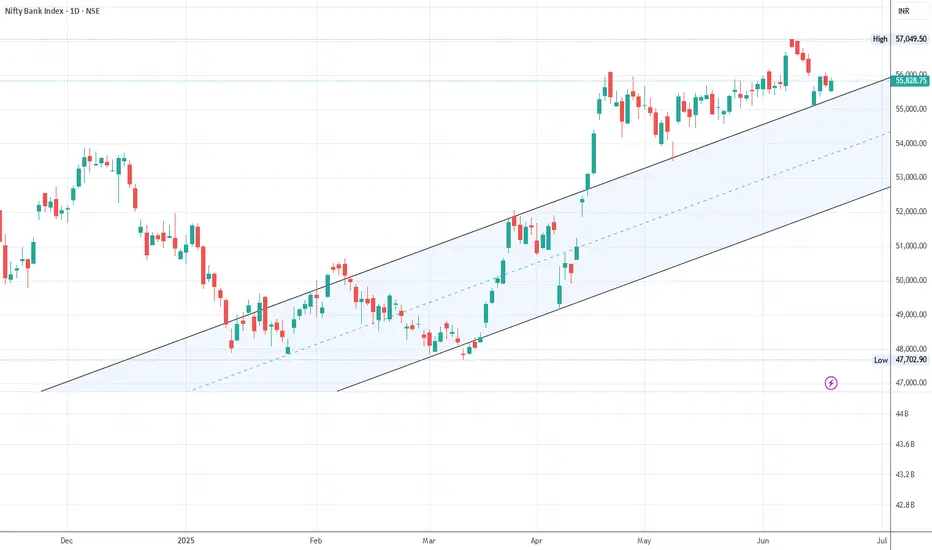
View on Banknifty We all have been following banknifty. It has been a go-to index for traders, whether they are short term or long term. Everyone has his own strategic view to dissect it. On 25th April, it moved out of the channel. The channel was touched again on 9th May. It returned again on June 13th.
I think it will re-enter the channel before starting new uptrend. 53600 - 54000 is the level to look for.
This is not a buy/sell recommendation.
This post is only for educational purposes.
Kindly consult your financial advisor before investing.
Keep strict stoploss and money management rules.
Happy Trading!!
BankNifty levels - Jun 19, 2025Utilizing the support and resistance levels of BankNifty, along with the 5-minute timeframe candlesticks and VWAP, can enhance the precision of trade entries and exits on or near these levels. It is crucial to recognize that these levels are not static, and they undergo alterations as market dynamics evolve.
The dashed lines on the chart indicate the reaction levels, serving as additional points of significance. Furthermore, take note of the response at the levels of the High, Low, and Close values from the day prior.
We trust that this information proves valuable to you.
* If you found the idea appealing, kindly tap the Boost icon located below the chart. We encourage you to share your thoughts and comments regarding it.
Wishing you successful trading endeavors!
[INTRADAY] #BANKNIFTY PE & CE Levels(18/06/2025)Today, Bank Nifty is expected to open with a slight gap down near the 55,650–55,700 zone, indicating early signs of consolidation within a tight range.
🔼 If Bank Nifty sustains above the 55,550–55,600 levels after opening, it could trigger a bullish move towards the targets of 55,750 → 55,850 → 55,950+.
🔽 However, if Bank Nifty approaches the 55,950–55,990 zone and shows signs of reversal, a corrective fall may follow with potential downside targets at 55,750 → 55,650 → 55,550.
🔻 A clear breakdown below the 55,450 level would indicate bearish strength, and the next downside levels to watch are 55,250 → 55,150 → 55,050-.
🚀 On the upside, if Bank Nifty manages to break out above the key resistance of 56,050, we can expect a strong rally with targets at 56,250 → 56,350 → 56,450+.

BankNifty levels - Jun 18, 2025Utilizing the support and resistance levels of BankNifty, along with the 5-minute timeframe candlesticks and VWAP, can enhance the precision of trade entries and exits on or near these levels. It is crucial to recognize that these levels are not static, and they undergo alterations as market dynamics evolve.
The dashed lines on the chart indicate the reaction levels, serving as additional points of significance. Furthermore, take note of the response at the levels of the High, Low, and Close values from the day prior.
We trust that this information proves valuable to you.
* If you found the idea appealing, kindly tap the Boost icon located below the chart. We encourage you to share your thoughts and comments regarding it.
Wishing you successful trading endeavors!

[INTRADAY] #BANKNIFTY PE & CE Levels(17/06/2025)Today, Bank Nifty is expected to open flat near the 55,970 zone. The market has shown a steady recovery over the past few sessions, and now it stands near a crucial resistance level. If Bank Nifty manages to sustain above the 56,000–56,050 level after the opening, we may see bullish momentum picking up. This could lead to a move toward the higher levels of 56,250, 56,350, and even 56,450+ in the intraday session. A breakout above 56,050 with volume confirmation can act as a trigger for continued upside.
On the flip side, if Bank Nifty struggles to hold above 55,950 and slips below this level, it may face intraday selling pressure. A breakdown can drag the index back down toward 55,750 initially, followed by 55,650 and 55,550 if weakness persists. These levels will act as immediate support zones where short covering or fresh buying may be seen.
Overall, the index remains in a narrow range with critical levels on both ends. A directional move can emerge if either side breaks with strength. Traders should remain cautious and avoid aggressive positions near the opening. Trade with a strict stop loss and consider trailing profits once levels are achieved, as the market may remain choppy around key zones.

BankNifty levels - Jun 17, 2025Utilizing the support and resistance levels of BankNifty, along with the 5-minute timeframe candlesticks and VWAP, can enhance the precision of trade entries and exits on or near these levels. It is crucial to recognize that these levels are not static, and they undergo alterations as market dynamics evolve.
The dashed lines on the chart indicate the reaction levels, serving as additional points of significance. Furthermore, take note of the response at the levels of the High, Low, and Close values from the day prior.
We trust that this information proves valuable to you.
* If you found the idea appealing, kindly tap the Boost icon located below the chart. We encourage you to share your thoughts and comments regarding it.
Wishing you successful trading endeavors!

Bank Nifty Weekly Insights: Key Levels & TrendsBank Nifty ended the week at 55,527.35 with a loss of -1.86%
Key Levels for the Upcoming Week
🔹 Price Action Pivot Zone:
The critical range to monitor for potential trend reversals or continuation is 55,410 to 55,645
🔹 Support & Resistance Levels:
Support Levels:
S1: 55,058
S2: 54,588
S3: 54,119
Resistance Levels:
R1: 56,000
R2: 56,474
R3: 56,947
Market Outlook
✅ Bullish Scenario: A sustained move above 55,645 could trigger buying momentum, potentially driving Bank Nifty towards R1 (56,000) and beyond.
❌ Bearish Scenario: If the index falls below 55,410, selling pressure may increase, pulling it towards S1 (55,058) and lower levels.
Disclaimer: lnkd.in

[INTRADAY] #BANKNIFTY PE & CE Levels(16/06/2025)Today, a slightly gap-up opening is expected in Bank Nifty near the 55,550–55,600 zone. If Bank Nifty sustains above this zone, it may attempt an upside move toward 55,750, 55,850, and potentially 55,950+ levels during the session.
If Bank Nifty starts trading above 56,050, a further bullish rally can be seen, taking it higher toward the 56,250, 56,350, and 56,450+ zones.
On the downside, if Bank Nifty slips below the 55,450–55,400 zone, it may face further selling pressure, leading to a possible move toward 55,250, 55,150, and 55,050 levels.
