Banknifty December 3rd Week AnalysisBanknifty is looking interesting on charts . While forming W pattern on charts indication breakout it is still in cautious zone. We need to wait and watch for upside confirmation . Range for strong upside is 53923-54116 , once it crosses this range it can give strong upside upto 54984+ in the upcoming week. Otherwise expect highly volatile moves in Banknifty.
BANKNIFTY trade ideas

BANKNIFTY S/R for 16/12/24Support and Resistance Levels:
Support Levels: These are price points (green line/shade) where a downward trend may be halted due to a concentration of buying interest. Imagine them as a safety net where buyers step in, preventing further decline.
Resistance Levels: Conversely, resistance levels (red line/shade) are where upward trends might stall due to increased selling interest. They act like a ceiling where sellers come in to push prices down.
Breakouts:
Bullish Breakout: When the price moves above resistance, it often indicates strong buying interest and the potential for a continued uptrend. Traders may view this as a signal to buy or hold.
Bearish Breakout: When the price falls below support, it can signal strong selling interest and the potential for a continued downtrend. Traders might see this as a cue to sell or avoid buying.
MA Ribbon (EMA 20, EMA 50, EMA 100, EMA 200) :
Above EMA: If the stock price is above the EMA, it suggests a potential uptrend or bullish momentum.
Below EMA: If the stock price is below the EMA, it indicates a potential downtrend or bearish momentum.
Trendline: A trendline is a straight line drawn on a chart to represent the general direction of a data point set.
Uptrend Line: Drawn by connecting the lows in an upward trend. Indicates that the price is moving higher over time. Acts as a support level, where prices tend to bounce upward.
Downtrend Line: Drawn by connecting the highs in a downward trend. Indicates that the price is moving lower over time. It acts as a resistance level, where prices tend to drop.
Disclaimer:
I am not a SEBI registered. The information provided here is for learning purposes only and should not be interpreted as financial advice. Consider the broader market context and consult with a qualified financial advisor before making investment decisions.

BANKNIFTY 55000 NEXT WEEK?This chart represents the #BankNifty Index on a 30-minute timeframe. The image illustrates a breakout scenario from a consolidation phase (highlighted in yellow) following a descending trendline. The breakout is confirmed by a sharp upward price movement backed by increasing volume, indicating strong bullish momentum.
The green zone marks the potential upside levels between 53,890 and 54,870, calculated using Fibonacci extensions. The bullish target points to the 161.8% level around 54,870. The red zone highlights the invalidation level for the bullish view, set at 53,100 on a closing basis. A close below this level would signal a potential reversal or further downside pressure.
The chart also incorporates key Fibonacci retracement levels, where the 100% level at 53,888 acts as immediate resistance. The current price of 53,630.55 trades above critical retracement zones, providing further confidence in a bullish continuation.
Traders should monitor price action near resistance and support zones and confirm with volume spikes for entry or exit signals. A sustained move above the resistance may fuel further gains toward the targets, while a breakdown below the invalidation level could invite bearish sentiment.

Looking for buy in bank nifty as per given levelLooking for buy in bank nifty as per given level- with that tight sl - let see what market do on that give level

[INTRADAY] #BANKNIFTY PE & CE Levels(13/12/2024)Today will be slightly gap down opening expected in banknifty. After opening important level for banknifty is 53050 support level. Possible reversal from this level towards the 53450 and this can be extend for further 400-500+ points in case banknifty starts trading above 53550. Strong downside fall expected if banknifty not sustain above level and starts trading below 52950. This downside rally can goes upto 52550 in today's session.

BANKNIFTY : Trading levels and plan for 13-Dec-2024Introduction
In the previous day's plan, we analyzed the Nifty Bank Index on a 15-minute timeframe and identified key support and resistance levels. The chart highlighted a sideways trend in the yellow zone, a bullish trend in the green zone, and a bearish trend in the red zone. The actual price movement today followed the anticipated path, consolidating within the highlighted zones and providing opportunities for both long and short trades.
Trading Plan for 13-Dec-2024
Gap Up Opening (200+ points)
If the market opens with a gap up above 53,533.00, monitor for a potential retracement to the golden retracement zone (53,533.00 - 53,736.00). Look for bearish signals in this zone to initiate short positions.
If the price sustains above 53,736.00, consider it a bullish sign and look for long opportunities targeting the deep retracement zone of the last swing (53,977.00 - 54,077.00).
Place stop-loss orders below 53,533.00 to manage risk effectively.
Flat Opening
If the market opens flat around 53,224.85, observe the price action around the important support zone (53,101.00 - 52,945.00).
If the price holds above 53,101.00, look for long opportunities targeting the golden retracement zone (53,533.00 - 53,736.00).
If the price breaks below 52,945.00, consider short positions targeting the important support zone (52,643.20 - 52,530.30).
Place stop-loss orders accordingly to manage risk.
Gap Down Opening (200+ points)
If the market opens with a gap down below 52,945.00, monitor for support around the important support zone (52,643.20 - 52,530.30).
If the price holds above 52,530.30, look for long opportunities targeting the important support zone (53,101.00 - 52,945.00).
If the price breaks below 52,530.30, consider it a bearish sign and look for short opportunities targeting lower levels.
Place stop-loss orders above 52,945.00 to manage risk.
Risk Management Tips for Options Trading
Always use stop-loss orders to limit potential losses.
Avoid over-leveraging and maintain a balanced portfolio.
Monitor implied volatility and time decay when trading options.
Diversify your trades to spread risk across different assets.
Summary and Conclusion
The trading plan for 13-Dec-2024 involves monitoring key levels and zones for potential price movements. The plan includes strategies for gap up, flat, and gap down openings, with specific actions based on price behavior around important support and resistance levels. Effective risk management is crucial, especially when trading options, to protect against significant losses.
Disclaimer : I am not a SEBI registered analyst. This plan is for educational purposes only and should not be considered financial advice. Always conduct your own research and consult with a professional before making any trading decisions.

BANK NIFTY S/R for 13/12/24Support and Resistance Levels:
Support Levels: These are price points (green line/shade) where a downward trend may be halted due to a concentration of buying interest. Imagine them as a safety net where buyers step in, preventing further decline.
Resistance Levels: Conversely, resistance levels (red line/shade) are where upward trends might stall due to increased selling interest. They act like a ceiling where sellers come in to push prices down.
Breakouts:
Bullish Breakout: When the price moves above resistance, it often indicates strong buying interest and the potential for a continued uptrend. Traders may view this as a signal to buy or hold.
Bearish Breakout: When the price falls below support, it can signal strong selling interest and the potential for a continued downtrend. Traders might see this as a cue to sell or avoid buying.
MA Ribbon (EMA 20, EMA 50, EMA 100, EMA 200) :
Above EMA: If the stock price is above the EMA, it suggests a potential uptrend or bullish momentum.
Below EMA: If the stock price is below the EMA, it indicates a potential downtrend or bearish momentum.
Trendline: A trendline is a straight line drawn on a chart to represent the general direction of a data point set.
Uptrend Line: Drawn by connecting the lows in an upward trend. Indicates that the price is moving higher over time. Acts as a support level, where prices tend to bounce upward.
Downtrend Line: Drawn by connecting the highs in a downward trend. Indicates that the price is moving lower over time. It acts as a resistance level, where prices tend to drop.
Disclaimer:
I am not a SEBI registered. The information provided here is for learning purposes only and should not be interpreted as financial advice. Consider the broader market context and consult with a qualified financial advisor before making investment decisions.

BankNifty Intraday Support & Resistance Levels for 13.12.2024On Thursday, BankNifty opened negative, briefly climbing to a high of 53537.45 before sliding to a low of 53174.40. It closed at 53216.45, down 175 points from the previous close. Both the Weekly Trend (50 SMA) and Daily Trend (50 SMA) remain positive, indicating underlying strength.
Demand/Support Zones
Near Demand/Support Zone (125m): 52563.20 - 52780.90
Far Demand/Support Zone (Daily): 51693.95 - 52197.25
Far Demand/Support Zone (125m): 51693.95 - 51906.90
Supply/Resistance Zones
Near Supply/Resistance Zone (Weekly): 53741.40 - 54467.35 (Tested)

Bank Nifty | Short | STBT | IntradayI have taken short on BN.
Daily support zone has been violated and 53,040 level could be tested.
This is a quick trade.

[INTRADAY] #BANKNIFTY PE & CE Levels(12/12/2024)Today will be slightly gap up opening expected in banknifty near 53500 level. Currently market creating the consolidation zone. After opening if banknifty starts trading and sustain above 53550 then can go for the long side position. Downside possible below 53450 level. 53050 level will act as a strong support for banknifty. Any major bearish rally only expected below this level.

BANKNIFTY : Trading Levels and Plan for 12-Dec-2024Bank Nifty Trading Plan for 12-Dec-2024
Intro: Plan vs Actual for 11-Dec-2024
Yesterday, our plan identified key zones for Bank Nifty, including the "Liquidity Zone" and the "Buyer’s Entry Zone." Bank Nifty opened near the projected "Opening Support/Resistance Zone" at 53,398 and consolidated around the "Liquidity Zone" before attempting a breakout towards the resistance at 54,034. The market respected the identified levels, providing opportunities for both scalpers and swing traders. However, the upward movement lacked strong momentum beyond 54,034, leading to a sideways close near 53,392.
Trading Plan for 12-Dec-2024
Gap Up Opening (200+ Points):
If Bank Nifty opens significantly above 53,600:
- Immediate focus will be on the "Liquidity/NO Trade Zone" at 53,699. Wait for the first 15-minute candle to confirm strength.
- A sustained move above 53,699 can lead to a test of the "First Resistance Zone" at 54,034-54,479. Consider initiating long positions only after an hourly close above 54,034 with targets towards 54,479.
- If rejection occurs near 54,034, intraday shorts can be explored with targets back to 53,699, keeping stop-loss above 54,100.
- Risk Tip: Use deep out-of-the-money (OTM) options for breakout trades to reduce premium risk.
Flat Opening:
If Bank Nifty opens near 53,398:
- This level serves as "Opening Support/Resistance Zone." Expect range-bound movement initially.
- A breakout above 53,699 will signal bullish momentum, with targets of 54,034 and 54,479. Initiate long trades above 53,699, keeping a strict stop-loss below 53,398.
- A breakdown below 53,398 could lead to a test of 53,069, which is the "Buyer’s Support Zone for Consolidation." Watch for reversal patterns here to re-enter longs.
- Risk Tip: Avoid aggressive positions during sideways trends (Yellow zones).
Gap Down Opening (200+ Points):
If Bank Nifty opens below 53,200:
- Monitor the "Buyer’s Try Zone" at 52,968-53,069. This is a critical demand zone; a strong reversal here can provide long opportunities with a target back towards 53,398.
- If this zone fails to hold, expect a sharper decline towards the "Must Try Zone for Buyers" at 52,531-52,650. Wait for a bullish reversal signal before initiating trades.
- For intraday shorts, look for breakdown confirmation below 52,968 with a target towards 52,531.
- Risk Tip: Deploy hedged positions like straddles/strangles during volatile gap-down openings.
Tips for Risk Management in Options Trading:
Always trade with defined stop-loss levels. For options, set a premium stop-loss (e.g., 30-50%).
Avoid overleveraging. Position size should not exceed 2-3% of your trading capital.
Monitor IV (Implied Volatility) spikes, especially during news-heavy sessions.
Use spreads to minimize premium decay in sideways markets.
Summary and Conclusion:
- Bank Nifty is at a critical juncture with a potential for high volatility. Key levels to watch are 54,034 on the upside and 52,968 on the downside.
- Follow the plan with discipline and respect stop-loss levels.
Disclaimer:
I am not a SEBI-registered analyst. This plan is for educational purposes only. Please consult your financial advisor before making any trading decisions.

Banknifty Intraday Trade Setup,technical analysis |12th Dec 2024Bank nifty moments for option and future trading 12/Dec/2024
BANKNIFTY (53,391) Banknifty is currently in Positive trend. If you are holding long positions then continue to hold with daily closing stoploss . Fresh short position can be initiated if Banknifty closes below 52845 levels.
follow us for more updates information.
message us for any stocks related information.

BankNifty Intraday Support & Resistance Levels for 12.12.2024On Wednesday, BankNifty opened negative and traded in a volatile range. It touched a low of 53302.15 before recovering to a high of 53648.05, ultimately closing at 53392.25, losing 185 points over the previous close. The Weekly Trend (50 SMA) and Daily Trend (50 SMA) remain positive.
Demand/Support Zones
Near Demand/Support Zone (125m): 52563.20 - 52780.90
Far Demand/Support Zone (Daily): 51693.95 - 52197.25
Far Demand/Support Zone (125m): 51693.95 - 51906.90
Far Demand/Support Zone (Daily): 49787.10 - 50983.50
Supply/Resistance Zones
Near Supply/Resistance Zone (Weekly): 53741.40 - 54467.35 (Tested)
Key Insights
Resistance at 53750: BankNifty continues to face resistance near this level. A decisive breakout could pave the way toward 54400 and beyond.
Support at 52780: Watch for demand near this zone; a breach could signal further downside toward 52200.

BANKNIFTY 30minIt seems that Banknifty is rising in its corrective bounce and we are doing wave 4 of wave A, if these count may unfold to the reality than banknifty may complete its wave A near 54500.

BANKNIFTY KEY LEVELS 12/12/2024//@description
// All credit goes to Tony for the concept of this indicator. His Trading View link: www.tradingview.com
// Note: The calculation method in this indicator differs from Tony's, but the concept is derived from his work.
**Explanation:**
This trading system helps you avoid blind trades by providing confirmation for better entries and exits. It considers volume, past prices, price range and indiavix.
**Entry/Exit Points:**
- **Entry/Exit Lines:** Use the BLACK line for long trades and the RED line for short trades, based on confirmation from your trading plan.
- **Stop Loss:** For long trades, set the stop loss at the RED line below. For short trades, set it at the BLACK line above.
- **Take Profit:** For long trades, target the next RED line above. For short trades, target the next BLACK line below.
**Timeframe:**
Use a 5 timeframe for trading.
**Risk Disclaimer:**
This setup is for educational purposes. I'm not responsible for your gains or losses. Check the chart for more details.

54300 Soon?Analysis on NSE:BANKNIFTY
There is a strong support at 53350 level if not broken on daily we will see 54300 soon.
Disclaimer:
I am not SEBI-registered. This is NOT trading advice.

[INTRADAY] #BANKNIFTY PE & CE Levels(11/12/2024)Today will be flat opening expected in banknifty. After opening if banknifty sustain above 53550 level then possible upside rally upto 53950 level in today's session and this rally can be extend for further 400-500+ points in case banknifty gives breakout of 54050 level. Any major downside only expected if banknifty starts trading below 53450 level.

Banknifty technical analysis for today (11/Dec/2024)Bank Nifty moments for option and future trading 11/Dec/2024
follow us for more updates information.
message us for any stocks related information

BANKNIFTY : Trading plan and Levels for 11-Dec-2024Previous Day's Chart Pattern Analysis:
The chart for 10-Dec-2024 shows significant price movement with clear areas of interest. The market showed a liquidity sweep near the 53,069 zone , followed by consolidation. A CHoCH (Change of Character) around 53,398 indicated a shift in trend. The resistance near 54,034 remains crucial, and breaking this could lead to a bullish rally toward new highs. The yellow trend represents sideways movement, the green trend shows bullish momentum, and the red trend indicates bearish possibilities.
Trading Plan for 11-Dec-2024:
Scenario 1: Gap Up Opening (200+ points above the previous close):
If Bank Nifty opens around 53,957 or above , the first resistance zone at 54,034 becomes crucial. Wait for price action near this level.
Plan of Action:
If it breaks and sustains above 54,034 , initiate a long position with a target of 54,479 . Place a stop loss just below 53,957 .
If there’s a rejection at 54,034 , look for short opportunities targeting 53,699 (Opening Support).
Avoid aggressive entries in the first 15 minutes to allow volatility to settle.
]
Scenario 2: Flat Opening (Within 50 points of the previous close):
If Bank Nifty opens near 53,604 , the Liquidity / NO Trade Zone (between 53,699 and 53,398) becomes the focus.
Plan of Action:
If the price stays within this range, avoid trades and wait for a breakout.
On a breakout above 53,699 , go long with a target of 54,034 . Keep a stop loss below 53,550 .
If it breaks below 53,398 , short the market targeting the Buyer's Support Zone near 53,069 .
Use small lot sizes to manage risk until a clear trend emerges.
Scenario 3: Gap Down Opening (200+ points below the previous close):
A gap down opening near 53,069 or lower will test the buyer’s strength.
Plan of Action:
If the price takes support near 53,069 , look for bullish reversal patterns and initiate a long position with a target of 53,398 . Keep a stop loss below 52,968 .
If it breaks below 52,968 , further downside to the Must Try Zone for Buyers at 52,650 is possible. Watch for reversals here to take long positions.
Avoid chasing the trend blindly in the first hour; let the market stabilize before entry.
Risk Management Tips for Options Trading:
Always calculate your risk before entering a trade. Limit risk to 1-2% of your total capital per trade.
For gap openings, avoid buying options immediately due to high premiums; wait for IV (implied volatility) to cool down.
Use spreads (e.g., Bull Call Spreads or Bear Put Spreads) to minimize risk.
Avoid overtrading and stick to predefined levels.
Summary and Conclusion:
For 11-Dec-2024, focus on key levels: 54,034 (Resistance), 53,699 (Support/Resistance), and 53,069 (Major Support). React based on price action and avoid impulsive decisions. The yellow zones suggest consolidation, green zones show bullish potential, and red zones indicate bearish sentiment. Maintain strict risk management and use options wisely.
Disclaimer: I am not a SEBI-registered analyst. The above analysis is for educational purposes only. Please consult your financial advisor before making any trading decisions.

BankNifty Intraday Support & Resistance Levels for 11.12.2024On Tuesday, BankNifty opened slightly positive but experienced a volatile trading session. It dipped to a low of 53302.65, then rallied in the final session to hit a high of 53624.05. It closed at 53577.70, marking a gain of 170 points over the previous close. Both the Weekly Trend (50 SMA) and Daily Trend (50 SMA) remain positive, signalling continued bullish momentum as of now.
Demand/Support Zones
Near Demand/Support Zone (15m): 52850.35 - 53038.60
Near Demand/Support Zone (75m): 52563.20 - 52780.90
Far Demand/Support Zone (125m): 51693.95 - 51906.90
Far Demand/Support Zone (Daily): 49787.10 - 50983.50
Supply/Resistance Zones
Near Supply/Resistance Zone (Weekly): 53741.40 - 54467.35 (Tested)

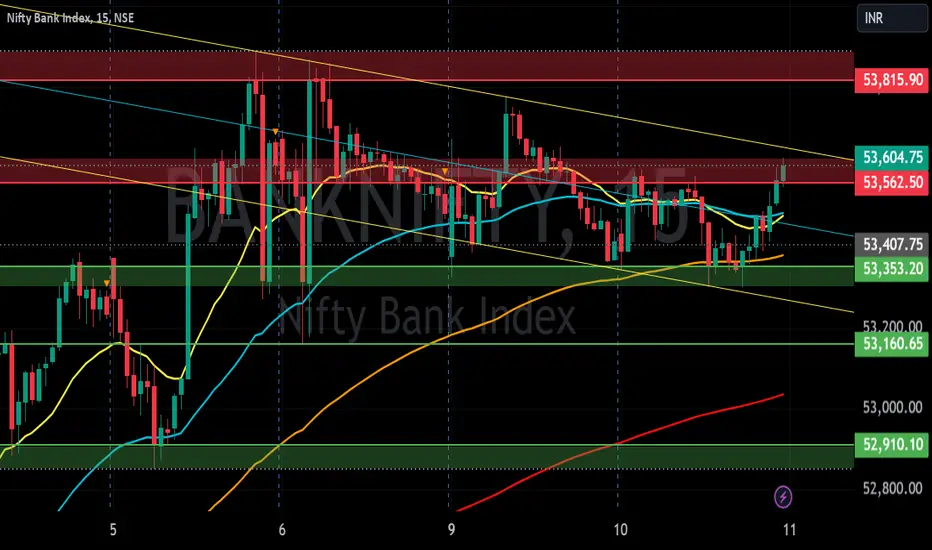
BANK NIFTY S/R for 11/12/24Support and Resistance Levels:
Support Levels: These are price points (green line/shade) where a downward trend may be halted due to a concentration of buying interest. Imagine them as a safety net where buyers step in, preventing further decline.
Resistance Levels: Conversely, resistance levels (red line/shade) are where upward trends might stall due to increased selling interest. They act like a ceiling where sellers come in to push prices down.
Breakouts:
Bullish Breakout: When the price moves above resistance, it often indicates strong buying interest and the potential for a continued uptrend. Traders may view this as a signal to buy or hold.
Bearish Breakout: When the price falls below support, it can signal strong selling interest and the potential for a continued downtrend. Traders might see this as a cue to sell or avoid buying.
MA Ribbon (EMA 20, EMA 50, EMA 100, EMA 200) :
Above EMA: If the stock price is above the EMA, it suggests a potential uptrend or bullish momentum.
Below EMA: If the stock price is below the EMA, it indicates a potential downtrend or bearish momentum.
Trendline: A trendline is a straight line drawn on a chart to represent the general direction of a data point set.
Uptrend Line: Drawn by connecting the lows in an upward trend. Indicates that the price is moving higher over time. Acts as a support level, where prices tend to bounce upward.
Downtrend Line: Drawn by connecting the highs in a downward trend. Indicates that the price is moving lower over time. It acts as a resistance level, where prices tend to drop.
Disclaimer:
I am not a SEBI registered. The information provided here is for learning purposes only and should not be interpreted as financial advice. Consider the broader market context and consult with a qualified financial advisor before making investment decisions.
BNF HUGE MOVES REMAING FOR DEC SERIESDEC series almost 12 trading sessions left bnf expected to see good volatility on both sides of around 2000+++ points which one will be attained quicker or simply time pass and decay premiums

BANKNIFTYBANKNIFTY FOR 11 Dec 2024
Banknifty bounced from the
weak demand zone 53330 - 53380
And took out Sell Zone created today (53540 - 53580)
OUTLOOK FOR 11 Dec 2024
Market may take support on the zone created today
(53540 - 53580) and Buy can be initiated for Target
Supply Zone @ 53820 - 53870
Weak demand zone (53330 - 53370) can be considered as strong buy zone
