Bank Nifty Trend Analysis for 09/12/2024Bank Nifty Trend Analysis for 09/12/2024
Chart have All Supports and Resistance as a Target level for Todays Analysis of Down Trend.
We will also record the video of this idea and share you for live trading recording session, so you can see how our indicator works in live market.
BANKNIFTY trade ideas

Banknifty technical analysis for tomorrow (10/Dec/2024)Bank Nifty moments for option and future trading 10/Dec/2024
follow us for more updates information.
message us for any stocks related information

BankNifty Intraday Support & Resistance Levels for 10.12.2024On Monday, BankNifty opened on a negative note, hitting a low of 53326.40 before rallying to a high of 53779.10. However, it couldn’t surpass Friday's high, facing resistance once again from the Weekly Supply Zone. It closed at 53407.75, losing 101 points. Both the Weekly Trend (50 SMA) and Daily Trend (50 SMA) remain positive, indicating a bullish undertone.
Demand/Support Zones
Near Demand/Support Zone (15m): 52850.35 - 53038.60
Near Demand/Support Zone (75m): 52563.20 - 52780.90
Far Demand/Support Zone (125m): 51693.95 - 51906.90
Far Demand/Support Zone (Daily): 49787.10 - 50983.50
Supply/Resistance Zones
Near Supply/Resistance Zone (Weekly): 53741.40 - 54467.35 (Tested)

BANKNIFTY : Levels and Strategies for 10-Dec-2024Trading Plan for Bank Nifty – 10-Dec-2024
Intro:
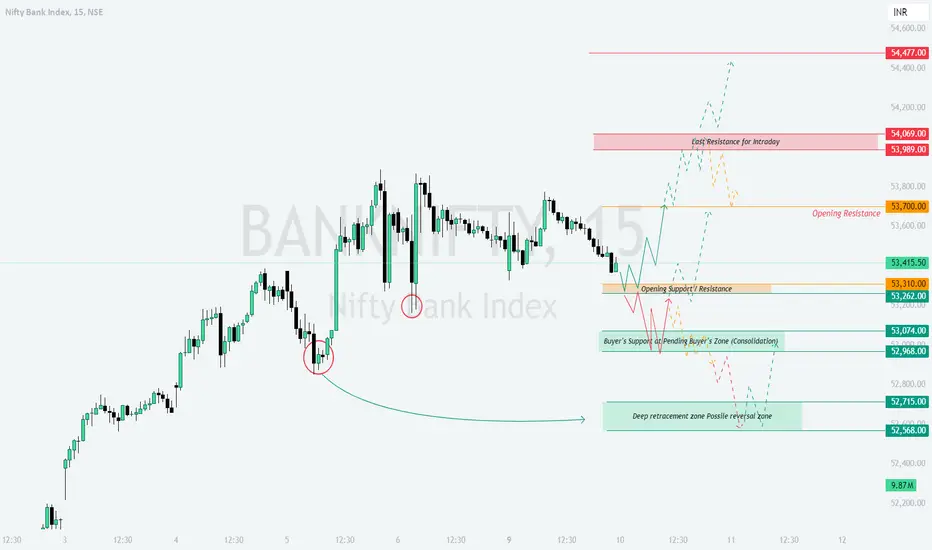
On the previous trading day, Bank Nifty exhibited a mixed trend with both bullish and bearish moments. The chart displayed notable buyer activity near 52,968 (read with the full plan), acting as a consolidation zone. Resistance levels at 53,700 and 54,069 capped upward movements, while support levels at 53,074 and 52,715 offered stability. The yellow trend marked potential sideways movement, green indicated bullish reversals, and red outlined bearish breakdowns.
Opening Scenarios:
Gap-Up Opening (+200 Points):
If Bank Nifty opens near 53,700–53,800, this aligns with the Opening Resistance . Wait for the first 15-minute candle to confirm price direction.
Action Plan:
If the price sustains above 53,800, initiate a long position targeting 54,069 as the next resistance, with a stop loss at 53,700.
However, if rejection is observed at 53,800, anticipate a pullback toward 53,415.50. Enter short trades below 53,700, aiming for 53,310.
Risk Management Tip: Avoid aggressive entries in the first 30 minutes. Monitor option premiums carefully for IV spikes.
Flat Opening:
If Bank Nifty opens near 53,415.50, it positions itself in the neutral zone.
Action Plan:
A breakout above 53,700 can signal bullish momentum toward 54,069. Initiate long positions with tight stop losses below 53,415.50.
In case of consolidation or a bearish breakdown below 53,310, short trades can be initiated targeting 53,074.
Risk Management Tip: Trail stop losses every 50 points to protect gains and reduce risks in volatile conditions.
Gap-Down Opening (-200 Points or More):
If Bank Nifty opens near 53,074 or lower, it may retest critical support zones at 52,968 or even 52,715.
Action Plan:
Watch for buying interest at 52,968–53,074; initiate long trades if bullish candles form, targeting 53,310 and 53,415.50.
A breakdown below 52,715 can push the index toward the Deep Retracement Zone of 52,568. Plan short trades with tight stop losses above 52,715.
Risk Management Tip: Avoid over-leveraging in gap-down scenarios, as volatility tends to increase. Focus on hedged option strategies like bull call spreads.
Summary & Conclusion:
Resistance Levels: 53,700 , 54,069
Support Levels: 53,310 , 52,968 , 52,715
The market may remain sideways (yellow trend) unless clear breakouts or breakdowns occur. Adopt a disciplined approach and avoid emotional trading during volatile phases.
Disclaimer:
This analysis is for educational purposes only. I am not a SEBI-registered analyst. Traders are advised to conduct their research or consult financial experts before taking any positions.
BANKNIFTY BANKNIFTY Levels for 10-12-2024
BANKNIFTY created a small demand zone at 53325 - 53375; It reacted strongly at 10:10 am
and again reacted later near the end of day.
But this looks like a weak demand zone.
With Strong support zone at 52600 - 52700, market seems sideways to bullish
BUY ZONE 1 - 53200 - 53250
BUY ZONE 2 - 52900 - 52980
SELL ZONE - 53800 - 53880

BN | Intraday | ShortBN is clearly rejecting the Daily pivot after it tried to go up.
A quick short trade - Intraday type can be taken till the next Daily support level at 53,155.
SL will be todays' high
Counter trend trade and hence risky. So should be traded with low quantity.

[INTRADAY] #BANKNIFTY PE & CE Levels(09/12/2024)Today will be slightly gap up opening expected in banknifty. After opening if banknifty sustain above 53550 level then possible upside rally upto 53950 level and this bullish rally can be extend for further 400-500+ points in case banknifty starts trading above 54050 level. Any major downside rally only expected below 53450 level.

Bank Nifty 10th Dec 2024Date 10th Dec 2024
Time 9:15 am IST
BIAS
Monthly-Bullish
Weekly-Not Sure
Daily-Bullish
4Hr-Bullish
1Hr-Not Sure
TRADE
GAP UP- No Trade
GAP DOWN- Look for reversal candle on shorter timeframes near 53100 or below, for call trades.

BankNifty Intraday Support & Resistance Levels for 09.12.2024On Friday, BankNifty exhibited volatility, touching a low of 53160.65 before rallying to a high of 53868.50. It eventually closed at 53509.50, down by 94 points. The Weekly Trend (50 SMA) remains sideways, while the Daily Trend (50 SMA) stays positive.
Demand/Support Zones
Near Demand/Support Zone (15m): 52850.35 - 53038.60
Near Demand/Support Zone (75m): 52563.20 - 52780.90
Far Demand/Support Zone (125m): 51693.95 - 51906.90
Far Demand/Support Zone (Daily): 49787.10 - 50983.50
Supply/Resistance Zones
Near Supply/Resistance Zone (Weekly): 53741.40 - 54467.35 (Tested)

Banknifty technical analysis for tomorrow (09/Dec/2024)Bank Nifty moments for option and future trading 09/Dec/2024
follow us for more updates information.
message us for any stocks related information

BankNifty Intraday Trade Setup | 9th DecFriday due to RBI policy BankNifty was highly volatile in the first hour, we took 53500 PE around 690 which made a high above 940 and gave good profit.
For tomorrow, buy BankNifty if sustains above 53630 for the targets of 53800 and 53950. On the other side sell BankNifty if sustains below 53370 for the targets of 53200 and lower marked level on the chart.
Expectations: Volatile day.
Intraday Levels:
Buy Above - 53630
Sell Below - 53370
To motivate us, Please like the idea If you agree with the analysis.
Happy Trading!
InvestPro India Team

Weekly Analysis 8th Dec 2024 Weekly Analysis 8th Dec 2024 | Nifty | Bank Nifty | CDSL | Siyaram Silks | Tolins Tyres | Kitex Garment | Goldiam International

Bank Nifty - December 2nd Week AnalysisBanknifty is showing some positive signs, and if it breaks above 54,048, it could potentially reach 55,200-50,000. However, if it fails to maintain this level, it might remain in a volatile range throughout the week. Keep an eye on 54,048, as it’s a crucial breakout level for Banknifty.

BANKNIFTY : Trading Plan and Levels for 09-Dec-2024 Bank Nifty Trading Plan for 09-Dec-2024
Previous Day's Chart Pattern:
On 08-Dec-2024, Bank Nifty exhibited a consolidation pattern and forming a No Trade Zone , with price movement oscillating between 53,487 and 53,699. Buyers displayed confidence at the golden retracement zone but faced resistance near 54,258. The yellow zone marked a sideways trend, while green indicated bullish attempts that were capped by red bearish resistance levels. This sets the stage for multiple potential scenarios tomorrow.
Trading Plan for 09-Dec-2024:
Gap-Up Opening (+200 points or more above 53,699):
If Bank Nifty opens above 53,699 and sustains, the index is likely to test the first resistance at 54,258 . Watch for price action at this level:
If it breaks above 54,258, the next target will be 54,479 (potential new all-time high resistance). Consider initiating long positions near 54,258 with a stop loss just below 54,185.
However, if rejection occurs at 54,258, expect a pullback toward 53,699 . In this case, avoid aggressive longs and wait for confirmation before re-entering trades.
Risk Management Tip: For options buyers, focus on ATM or slightly OTM contracts with small quantities. If price approaches resistance zones, consider booking partial profits.
Flat Opening (Within the No Trade Zone 53,487–53,699):
In the case of a flat open, patience is key:
If price sustains above 53,699 , this will indicate bullish intent, targeting 54,258 . Go long after a clear breakout with stop loss near 53,487.
Conversely, if the index drops below 53,487, it may retest the key support zone at 53,017 . Initiate short trades cautiously with tight stop loss above 53,487.
Risk Management Tip: Avoid over-leveraging in a choppy zone. Wait for the first 30 minutes to gauge market sentiment.
Gap-Down Opening (-200 points or more below 53,487):
If Bank Nifty gaps down below 53,487:
Initial support lies at 53,017 . If this zone holds, we may see a reversal toward the No Trade Zone. Watch for bullish candlestick patterns to confirm a rebound.
If 53,017 breaks, the next key level is 52,715 (deep retracement and must-try support for buyers). Consider shorts below 53,017 with a target near 52,715, keeping a stop loss at 53,200.
Risk Management Tip: For bearish scenarios, buy puts cautiously. Avoid illiquid contracts and use spreads to limit risk.
Summary and Conclusion:
The market remains at a pivotal zone, with clear levels to monitor for breakouts or breakdowns.
Yellow zones highlight areas of consolidation, green zones indicate bullish trends, and red zones point to bearish resistance.
Adhere strictly to the No Trade Zone boundaries to avoid unnecessary risks.
Disclaimer: This analysis is for educational purposes only. I am not a SEBI-registered analyst. Traders are advised to do their own research or consult a financial advisor before trading.

BANK NIFTY S/R for 9/12/24Support and Resistance Levels:
Support Levels: These are price points (green line/shade) where a downward trend may be halted due to a concentration of buying interest. Imagine them as a safety net where buyers step in, preventing further decline.
Resistance Levels: Conversely, resistance levels (red line/shade) are where upward trends might stall due to increased selling interest. They act like a ceiling where sellers come in to push prices down.
Breakouts:
Bullish Breakout: When the price moves above resistance, it often indicates strong buying interest and the potential for a continued uptrend. Traders may view this as a signal to buy or hold.
Bearish Breakout: When the price falls below support, it can signal strong selling interest and the potential for a continued downtrend. Traders might see this as a cue to sell or avoid buying.
MA Ribbon (EMA 20, EMA 50, EMA 100, EMA 200) :
Above EMA: If the stock price is above the EMA, it suggests a potential uptrend or bullish momentum.
Below EMA: If the stock price is below the EMA, it indicates a potential downtrend or bearish momentum.
Trendline: A trendline is a straight line drawn on a chart to represent the general direction of a data point set.
Uptrend Line: Drawn by connecting the lows in an upward trend. Indicates that the price is moving higher over time. Acts as a support level, where prices tend to bounce upward.
Downtrend Line: Drawn by connecting the highs in a downward trend. Indicates that the price is moving lower over time. It acts as a resistance level, where prices tend to drop.
Disclaimer:
I am not a SEBI registered. The information provided here is for learning purposes only and should not be interpreted as financial advice. Consider the broader market context and consult with a qualified financial advisor before making investment decisions.

The Bank Nifty intraday trend forecast on December 09, 2024As per my study, on December 09, 2024, the Bank Nifty intraday trend may begin with Gap up opening and move sideways to bullish for the remaining day.
This information is only for the educational purposes.

Bank Nifty | Pre Market Weekly View | 09 Dec - 13 Dec 2024Bank Nifty closed the previous week with a strong Bullish candle which has closed comfortably above the 50% zone of the previous fall.
For the next week, I have a strong feeling that BN could be range bound to mildly Bullish.
The overall trend is certainly Bullish. However, since there has been a strong rally last week, there could be some profit booking.
Again, a buy on dip strategy can be applied here.
Upside resistance zone is 54,200.
So, if there's a big gap up, look for short side reversal.
If there's a gap down, look for price action and buy.

Bank Nifty December 2024Bank nifty now all most recovery your down trend may be bullish next week plz use stop loss and properly,
support zone to market reverse u can trade only bullish trend for support line
follow the trend,
bank nifty 200EMA all ready cross may be try for reverse for 200ema line then trend move for bullish

Banknifty December 1st Week Analysis The BankNifty index is currently exhibiting positive trends on the charts. A crucial level for the upside trajectory is 52400. If BankNifty successfully crosses and maintains its position above 52400 then expect an upward movement towards 53100 or higher. Conversely, if it fails to sustain above 52400, then expect range-bound movement.And if BankNifty breach 51500 on the downside, then downward movement towards 51000-50700 is possible.

nifty & bank nifty prediction this video is a only for educational purpose
nifty & bank nifty levels .

BankNifty Rockets: 1800+ Points Secured with Precision!BANKNIFTY on the 15-minute timeframe demonstrated a powerful bullish trend, delivering a substantial profit of 1800+ points. This long trade setup was flawlessly executed using the Risological Swing Trading Indicator , which accurately identified the entry point, targets, and stop-loss levels.
BankNifty Key Levels:
TP1: 52198.70 ✅
TP2: 52510.65 ✅
TP3: 52822.60 ✅
TP4: 53015.35 ✅
BankNiftyTechnical Analysis:
The trade was initiated at an entry level of 52005.90, with a well-placed stop-loss at 51849.95 to manage risk effectively.
The price action confirmed a strong upward momentum, crossing over the Risological trend line, which signaled a clear long entry.
All targets were achieved in quick succession, reflecting the precision and reliability of the Risological system.
This trade stands out as a prime example of capturing massive intraday moves with high accuracy.
NAMASTE!

BANKNIFTYHi guys,
In this chart i Found a Demand Zone in BANKNIFTY CHART for Positional entry,
Observed these Levels based on price action and Demand & Supply.
*Don't Take any trades based on this Picture.
... because this chart is for educational purpose only not for Buy or Sell Recommendation..
Thank you

[INTRADAY] #BANKNIFTY PE & CE Levels(06/12/2024)Slightly gap up opening expected in banknifty. After opening expected it will continue the bullish rally towards the 53950+ level and this rally can extend for further 400-500 points in case banknifty starts trading and sustain above 54050 level. Downside 53550 will act as a support for today's session. Any major downside only expected below this support zone.
