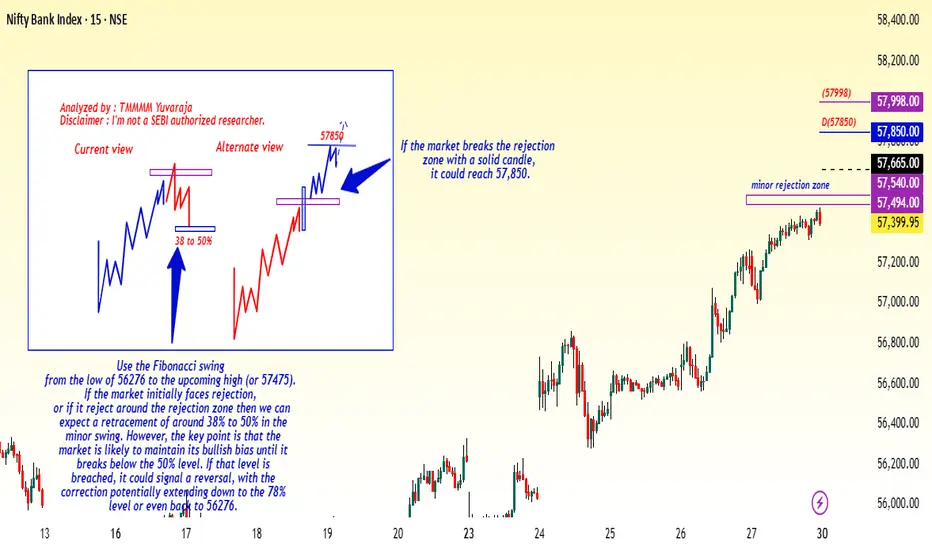
#Banknifty directions and levels for June 30The structures are still the same as what we saw in Friday’s session. We are currently in a minor consolidation zone, so if the market faces rejection near the immediate resistance, we can expect a retracement of around 38% to 50% in the minor swing.
On the other hand, if the market breaks the immediate resistance with a solid structure, then it could reach the next resistance level with the strong bullish bias.
BANKNIFTY trade ideas
bank nifty cashtime wise from 2 to 3rd wave top appear wave 4 yet not complete in irregular correction,
Alternatively we may be in wave 5 first wave let see Monday clear more picture , though some people started giving target of 59000+, if so this is wave 1 and still one correction due as bearish divergence also emergins in hourly charts. Thanz just a learner may be wrong and not a sebi registered RA.Thanz

Banknifty July 1st Week AnalysisNifty bank is looking positive for the week ahead and we can expect momentum to extend upto 58500-950 in the upcoming week. The important level to watch for upside momentum is 57800. Upon crossing and sustaining above 57800, we can expect upside momentum. On the downside, if Banknifty breaches 57200 and 57000, then we can expect a small retracement upto 56500-350.
ALL LEVELS ARE MARKED IN THE CHART POSTED .

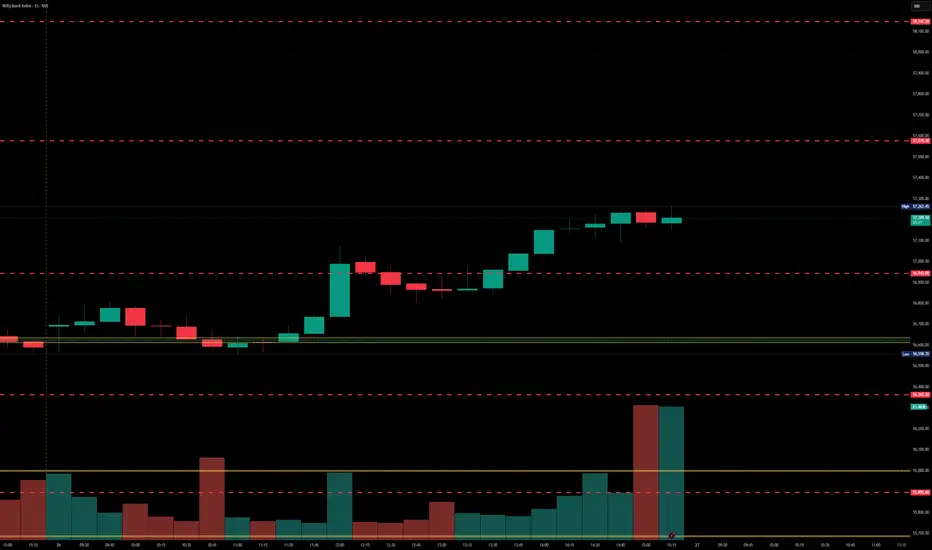
BankNifty levels - Jun 30, 2025Utilizing the support and resistance levels of BankNifty, along with the 5-minute timeframe candlesticks and VWAP, can enhance the precision of trade entries and exits on or near these levels. It is crucial to recognize that these levels are not static, and they undergo alterations as market dynamics evolve.
The dashed lines on the chart indicate the reaction levels, serving as additional points of significance. Furthermore, take note of the response at the levels of the High, Low, and Close values from the day prior.
We trust that this information proves valuable to you.
* If you found the idea appealing, kindly tap the Boost icon located below the chart. We encourage you to share your thoughts and comments regarding it.
Wishing you successful trading endeavors!

[INTRADAY] #BANKNIFTY PE & CE Levels(27/06/2025)Bank Nifty is expected to open with a strong gap up near the 57,500 level, indicating continued bullish sentiment from the previous session’s upward momentum. The index is currently trading above key support levels, and if it manages to sustain above the 57,450–57,500 zone, a further upward move is likely. In such a case, traders can consider buying CE options around 57,550–57,600 for targets of 57,750, 57,850, and 57,950+. This zone will act as a potential breakout area, and sustaining above it could trigger fresh buying interest.
However, if Bank Nifty fails to hold above the 57,450 level after the gap up, some profit booking or reversal may occur. In that scenario, a put option opportunity may arise near the 57,450–57,400 levels with downside targets of 57,250, 57,150, and 57,050.

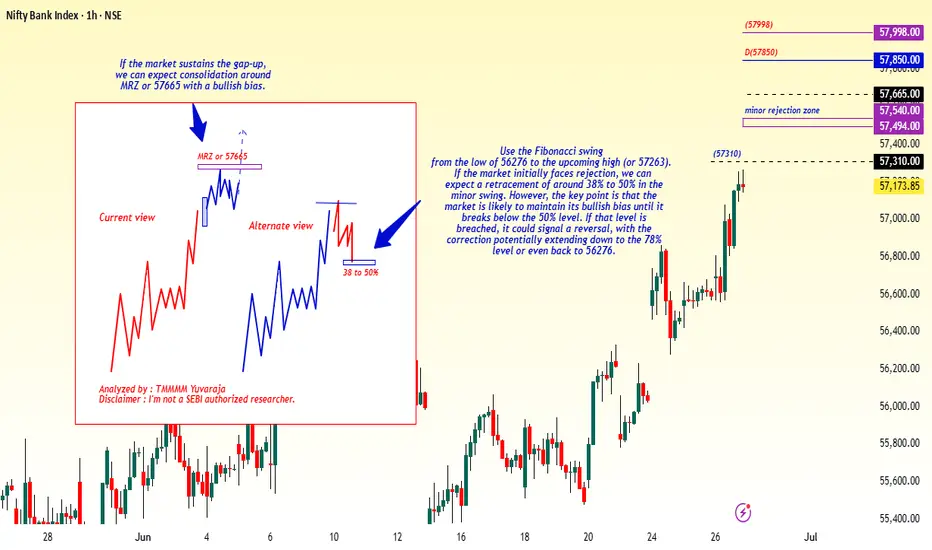
#Banknifty directions and levels for June 27Structurally, the trend still appears bullish. So, if the market opens with a strong candle formation,
we can expect a further continuation of the rally.
However, my personal opinion is based on sub-wave calculations, the upcoming wave could be the 4th wave—which is typically a consolidation phase.
So, after the gap-up, the market may consolidate around the immediate resistance zone.
On the other hand, if the gap-up does not sustain or if the market faces rejection near the immediate resistance,
it could lead to a correction of around 38% to 50% in the minor swing.
The key point here is: until the market breaks below the 50% level, the overall bias may remain bullish. But if the 50% mark is broken,
it could lead to a reversal, with deeper correction possible
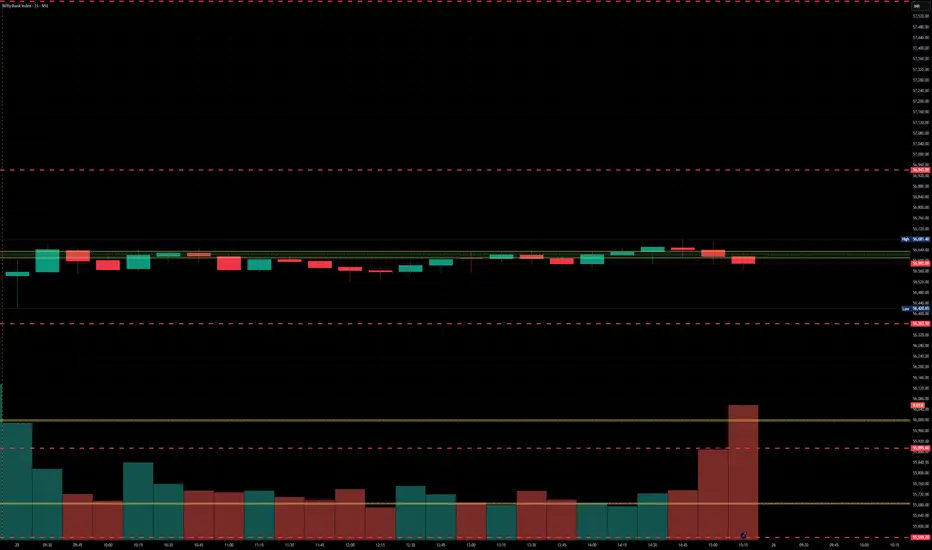
BankNifty levels - Jun 27, 2025Utilizing the support and resistance levels of BankNifty, along with the 5-minute timeframe candlesticks and VWAP, can enhance the precision of trade entries and exits on or near these levels. It is crucial to recognize that these levels are not static, and they undergo alterations as market dynamics evolve.
The dashed lines on the chart indicate the reaction levels, serving as additional points of significance. Furthermore, take note of the response at the levels of the High, Low, and Close values from the day prior.
We trust that this information proves valuable to you.
* If you found the idea appealing, kindly tap the Boost icon located below the chart. We encourage you to share your thoughts and comments regarding it.
Wishing you successful trading endeavors!
#Banknifty directions and levels for June 26:if the market breaks above the previous high, we can expect a further continuation of the rally.
On the other hand, if the market faces rejection around that level or if it starts with a decline, the range-bound movement is likely to continue.

[INTRADAY] #BANKNIFTY PE & CE Levels(26/06/2025)Today, Bank Nifty is likely to open slightly gap up near the 56,550–56,600 zone, which is a crucial resistance area. A sustained move above this zone can trigger bullish momentum, opening the door for further upside targets of 56,750, 56,850, and potentially 56,950+. Traders can look for buying opportunities in call options above this range with a tight stop-loss, especially if the index breaks out with strong volume and positive sentiment. The zone between 56,600 and 56,950 has acted as a resistance band in recent sessions, so a clean breakout may lead to a directional rally.
On the flip side, if Bank Nifty fails to hold above the 56,450 mark and starts to trade below it, we may see downside pressure in the market. This breakdown could offer a good short opportunity using put options, with downside targets around 56,250, 56,150, and 56,050. The 56,050 level will act as a strong support and could attract buyers again if tested. Traders should remain cautious near resistance and support zones and avoid aggressive positions unless there is clear confirmation. The market may remain volatile in the first half, so a wait-and-watch approach with disciplined risk management is advisable.

BankNifty levels - Jun 26, 2025Utilizing the support and resistance levels of BankNifty, along with the 5-minute timeframe candlesticks and VWAP, can enhance the precision of trade entries and exits on or near these levels. It is crucial to recognize that these levels are not static, and they undergo alterations as market dynamics evolve.
The dashed lines on the chart indicate the reaction levels, serving as additional points of significance. Furthermore, take note of the response at the levels of the High, Low, and Close values from the day prior.
We trust that this information proves valuable to you.
* If you found the idea appealing, kindly tap the Boost icon located below the chart. We encourage you to share your thoughts and comments regarding it.
Wishing you successful trading endeavors!
[INTRADAY] #BANKNIFTY PE & CE Levels(25/06/2025)Bank Nifty is expected to open slightly gap up near the 56,450 level. If the index sustains above 56,450, we may see a bullish continuation toward 56,550 and above. A move above the 56,550–56,600 zone can trigger further upside momentum with targets at 56,850, 56,950, and potentially 57,000+.
However, if Bank Nifty fails to hold above 56,450 and starts trading below 56,400, a short opportunity could arise. In that case, downside targets would be 56,250, 56,150, and 56,050. The 56,050 level will act as strong support for today's session, and only a break below this may invite a deeper correction.

#Banknifty directions and levels for June 25:Current View
The current structure suggests that even if the market opens with a gap-up, it may not sustain.
If the initial market declines and consolidates around the 78% Fibonacci level, then we can expect the correction to continue.
On the other hand, if the decline sees a solid pullback around 50%, then we can expect a minimum pullback of 38% to 61% in the minor swing.
Alternate View
Structurally, the probability of a rally continuation is low,
which means we won’t get a bullish signal unless the price breaks above the 56736)level.
If it does break, we can expect a rally, though some rejections may occur along the way.

BankNifty levels - Jun 25, 2025Utilizing the support and resistance levels of BankNifty, along with the 5-minute timeframe candlesticks and VWAP, can enhance the precision of trade entries and exits on or near these levels. It is crucial to recognize that these levels are not static, and they undergo alterations as market dynamics evolve.
The dashed lines on the chart indicate the reaction levels, serving as additional points of significance. Furthermore, take note of the response at the levels of the High, Low, and Close values from the day prior.
We trust that this information proves valuable to you.
* If you found the idea appealing, kindly tap the Boost icon located below the chart. We encourage you to share your thoughts and comments regarding it.
Wishing you successful trading endeavors!

#Banknifty directions and levels for June 24:Current View
As already discussed:
If the market breaks out or consolidates around the rejection zone, we can expect a further rally continuation towards a minimum of the 78% Fibonacci level —
On the other hand, if the market faces rejection and breaks the 38% Fibonacci level of the minor swing:
Then we can expect a minimum correction of 50% to 78% in that minor swing.( to use fib
(Bank Nifty: Low to High – 55,779 to the upcoming high
Alternate View
If the gap-up doesn’t sustain and the market breaks the 38% Fibonacci level of the minor swing:
Then again, we can expect a correction of at least 50% to 78% in the same swing..( to use fib
(Bank Nifty: Low to High – 55,779 to the upcoming high

[INTRADAY] #BANKNIFTY PE & CE Levels(24/06/2025)Today, a gap-up opening is expected in Bank Nifty near the 56,500 level. This zone lies close to a crucial resistance level, so price action after opening will be key. If Bank Nifty sustains above the 56,550–56,600 zone, it could trigger a strong upside rally toward 56,750, 56,850, and potentially 56,950+ levels. On the other hand, if it fails to hold above 56,000 and starts slipping below the 55,950–55,900 zone, a downside move is likely, which could push the index toward 55,750, 55,650, and 55,550 levels.

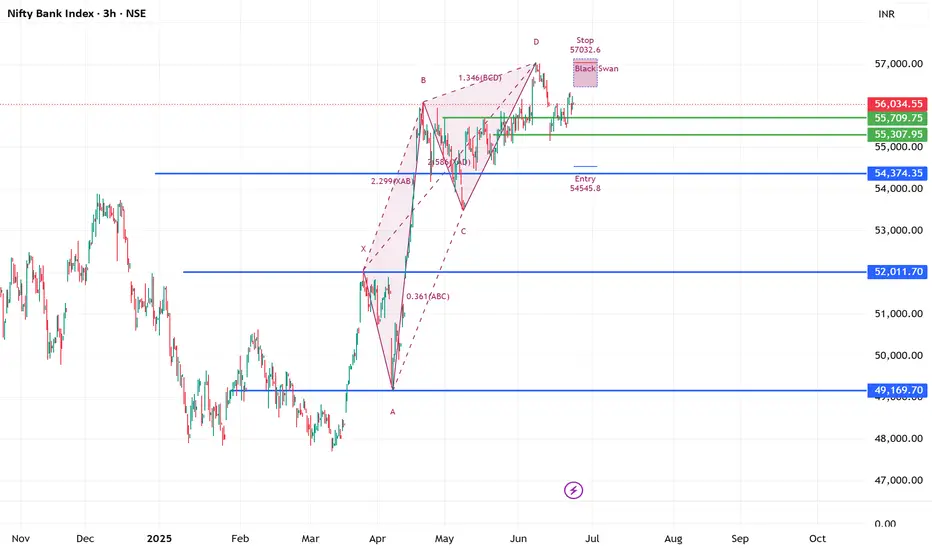
Berish Black Swan (Harmonic pattern) Running in #BANKNIFTY 3hrs56069 spot 23-06-2025
patterns clearly suggest after hitting ATH 57049
at this angel 1.346 BCD move completed by price
now due to amid war situation traders must take extra cautious approach
this is pure educational based study !!!!!
BankNifty levels - Jun 24, 2025Utilizing the support and resistance levels of BankNifty, along with the 5-minute timeframe candlesticks and VWAP, can enhance the precision of trade entries and exits on or near these levels. It is crucial to recognize that these levels are not static, and they undergo alterations as market dynamics evolve.
The dashed lines on the chart indicate the reaction levels, serving as additional points of significance. Furthermore, take note of the response at the levels of the High, Low, and Close values from the day prior.
We trust that this information proves valuable to you.
* If you found the idea appealing, kindly tap the Boost icon located below the chart. We encourage you to share your thoughts and comments regarding it.
Wishing you successful trading endeavors!
#Banknifty directions and levels for June 23:Current View
The current view suggests that if the market sustains the initial gap-down and consolidates, we can expect the correction to continue.
In this case, even if there is a solid pullback, the market may not move much higher.
This would mean it could consolidate between the previous day’s high and the upcoming low.
Alternate View
The alternate view suggests that if the market takes a pullback initially, it may consolidate within the previous day's range.
If it breaks the previous high after that, we can expect further rally continuation, possibly in a diagonal pattern.

[INTRADAY] #BANKNIFTY PE & CE Levels(23/06/2025)A flat opening is expected in Bank Nifty today. After the open, if Bank Nifty sustains above 56,050, an upside rally is likely toward 56,450+. A further continuation of this rally could occur if the index trades above 56,550–56,600, with extended targets up to 56,750 → 56,850 → 56,950+.
On the downside, if Bank Nifty trades below 55,950, some selling pressure may emerge. However, 55,550 will act as strong support for today’s session. A major downward move is only expected if this support breaks, opening potential targets of 55,250 → 55,150 → 55,050-.

Bank Nifty Weekly Insights: Key Levels & TrendsBank Nifty ended the week at 56,252.85 with a gain of 1.31%
Key Levels for the Upcoming Week
🔹 Price Action Pivot Zone:
The critical range to monitor for potential trend reversals or continuation is 56,135 to 56,372
🔹 Support & Resistance Levels:
Support Levels:
S1: 55,781
S2: 55,308
S3: 54,726
Resistance Levels:
R1: 56,729
R2: 57,206
R3: 57,786
Market Outlook
✅ Bullish Scenario: A sustained move above 56,372 could trigger buying momentum, potentially driving Bank Nifty towards R1 (56,729) and beyond.
❌ Bearish Scenario: If the index falls below 56,135, selling pressure may increase, pulling it towards S1 (56,729) and lower levels.
Disclaimer: lnkd.in

Banknifty June 4th Week Analysis Banknifty closing is looking positive, and we can expect upside momentum to continue up to 56600. Upon crossing 56600, we can expect a bigger upside momentum up to a new all-time high of 57267-57500. But if due to any global factors we encounter a bearish move, then imp levels on the downside would be 55770-55300.

BankNifty levels - Jun 23, 2025Utilizing the support and resistance levels of BankNifty, along with the 5-minute timeframe candlesticks and VWAP, can enhance the precision of trade entries and exits on or near these levels. It is crucial to recognize that these levels are not static, and they undergo alterations as market dynamics evolve.
The dashed lines on the chart indicate the reaction levels, serving as additional points of significance. Furthermore, take note of the response at the levels of the High, Low, and Close values from the day prior.
We trust that this information proves valuable to you.
* If you found the idea appealing, kindly tap the Boost icon located below the chart. We encourage you to share your thoughts and comments regarding it.
Wishing you successful trading endeavors!
[INTRADAY] #BANKNIFTY PE & CE Levels(20/06/2025)Today, a flat opening is expected in Bank Nifty, with price action likely to begin around 55,500 levels. There are no major changes in the key levels compared to yesterday, and the market has remained in a consolidation phase.
🔽 If Bank Nifty starts trading below 55,450, it may trigger further downside toward 55,250 → 55,150 → 55,050-. This zone has acted as intraday support recently.
🔼 On the other hand, a move above 55,550–55600 may lead to upward momentum toward 55,750 → 55,850 → 55,950+. A breakout above 56,050 could open the path toward 56,250 → 56,350 → 56,450+.
⚠️ Key Takeaways:
Consolidation continues, so avoid aggressive positions until a breakout occurs.
Watch for range breakouts above 56,050 or below 55,450 for directional moves.
Use tight stop-losses and trail profits smartly to protect against volatility spikes.
