Nifty Bank Parallel ChannelNifty Bank has formed a rising parallel channel. A breakout of the channel on either side can be traded. If it breaks on the downside, the rising channel gives a good move. plan your trades accordingly.
For Educational and Paper Trading purposes only.
BANKNIFTY trade ideas

BANK NIFTY S/R for 21/11/24Support and Resistance Levels:
Support Levels: These are price points (green line/shade) where a downward trend may be halted due to a concentration of buying interest. Imagine them as a safety net where buyers step in, preventing further decline.
Resistance Levels: Conversely, resistance levels (red line/shade) are where upward trends might stall due to increased selling interest. They act like a ceiling where sellers come in to push prices down.
Breakouts:
Bullish Breakout: When the price moves above resistance, it often indicates strong buying interest and the potential for a continued uptrend. Traders may view this as a signal to buy or hold.
Bearish Breakout: When the price falls below support, it can signal strong selling interest and the potential for a continued downtrend. Traders might see this as a cue to sell or avoid buying.
20 EMA (Exponential Moving Average):
Above 20 EMA(50 EMA): If the stock price is above the 20 EMA, it suggests a potential uptrend or bullish momentum.
Below 20 EMA: If the stock price is below the 20 EMA, it indicates a potential downtrend or bearish momentum.
Trendline: A trendline is a straight line drawn on a chart to represent the general direction of a data point set.
Uptrend Line: Drawn by connecting the lows in an upward trend. Indicates that the price is moving higher over time. Acts as a support level, where prices tend to bounce upward.
Downtrend Line: Drawn by connecting the highs in a downward trend. Indicates that the price is moving lower over time. It acts as a resistance level, where prices tend to drop.
RSI: RSI readings greater than the 70 level are overbought territory, and RSI readings lower than the 30 level are considered oversold territory.
Combining RSI with Support and Resistance:
Support Level: This is a price level where a stock tends to find buying interest, preventing it from falling further. If RSI is showing an oversold condition (below 30) and the price is near or at a strong support level, it could be a good buy signal.
Resistance Level: This is a price level where a stock tends to find selling interest, preventing it from rising further. If RSI is showing an overbought condition (above 70) and the price is near or at a strong resistance level, it could be a signal to sell or short the asset.
Disclaimer:
I am not a SEBI registered. The information provided here is for learning purposes only and should not be interpreted as financial advice. Consider the broader market context and consult with a qualified financial advisor before making investment decisions.

BANKNIFTY : Trading levels and Plan for 21-Nov-2024Bank Nifty Trading Plan for 21-Nov-2024
Intro:
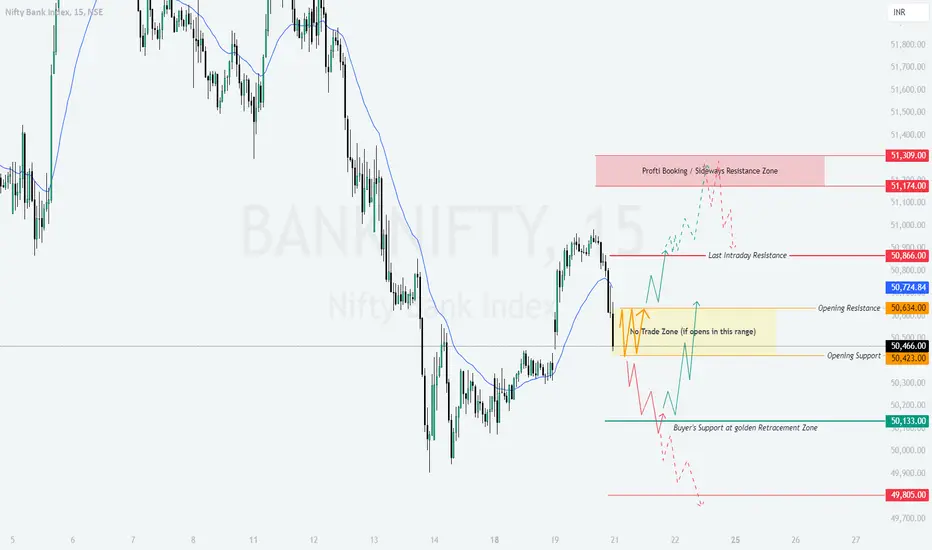
On 20-Nov-2024, Bank Nifty displayed a highly volatile session with price action respecting key levels. The index faced resistance around the 50,866 zone, marking it as the last intraday resistance. The yellow-shaded zone indicated a "No Trade Zone" due to the lack of directional clarity, while buyers found support near 50,133 , aligning with the golden Fibonacci retracement level. The green trend showcased bullish movements, while red trends reflected bearish pullbacks. This sets the stage for varied possibilities for 21-Nov-2024.
Trading Plan for 21-Nov-2024:
Gap Up Opening (200+ points above 50,724):
If Bank Nifty opens above 50,866 , watch for a sustained breakout above 51,174 . This could lead to a bullish continuation towards the Profit Booking Zone (51,309) .
Avoid immediate entry post-gap up; let the index settle for the first 15–30 minutes.
A failure to hold above 50,866 may signal a reversal, with the potential to retrace back to 50,634 .
Flat Opening (Near 50,634):
A flat opening near 50,634 suggests indecision. If prices break above 50,724 with volume, consider a bullish trade targeting 50,866 .
Conversely, if the price breaks below 50,466 , expect bearish momentum targeting 50,133 .
Remain cautious in the yellow-shaded "No Trade Zone." Focus on clear breakout/rejection signals before entering trades.
Gap Down Opening (200+ points below 50,466):
A gap down below 50,466 may lead to further bearish momentum towards the key support at 50,133 .
If 50,133 holds, look for signs of recovery to 50,466 or higher.
A break below 50,133 could trigger a strong bearish trend, targeting 49,805 . Trade with a tight stop-loss if initiating shorts.
Risk Management Tips for Options Traders:
Always define your maximum loss before entering a trade.
For intraday trades, use stop-losses based on the hourly candle close to avoid getting whipsawed by volatility.
Avoid over-leveraging. Stick to 1–2% risk per trade relative to your trading capital.
For gap openings, prefer directional options strategies like debit spreads to manage premium erosion effectively.
Summary and Conclusion:
Bank Nifty's key levels for the day are 50,133 (Buyer’s Support) and 50,866 (Resistance Zone).
Trade cautiously within the "No Trade Zone" ( 50,466 – 50,634 ).
Watch for clear directional moves, as trends are likely to be driven by intraday volatility.
Disclaimer:
I am not a SEBI-registered analyst. This trading plan is for educational purposes only. Traders are advised to conduct their analysis or consult a financial advisor before making any trading decisions.
BankNifty Support and Resistance Levels For 21st Nov 2024I’ve created a chart highlighting the key support and resistance levels for #BankNifty, designed to help traders make informed decisions.
These levels provide critical insights for understanding potential price movements, enabling traders to identify ideal entry and exit points.
Use these levels to gain a clearer perspective on Sensex trends and optimize your trades with greater confidence.
Remember, these levels serve as guidance, so always combine them with your own analysis and risk management.

[INTRADAY] #BANKNIFTY PE & CE Levels(19/11/2024)Today will be slightly gap up opening expected in banknifty. Expected opening near 50500 level. After opening if banknifty starts trading above 50550 level then possible upside bullish rally in index. 50500 level will act as a immediate resistance. Reversal from this level can give downside potential upto 400-500 points and this can be extend further upto 49550 level in case banknifty starts trading below 49950 level in today's session.

BANKNIFTY : Trading levels and plan for 19-Nov-2024Intro: Observations from the Previous Day
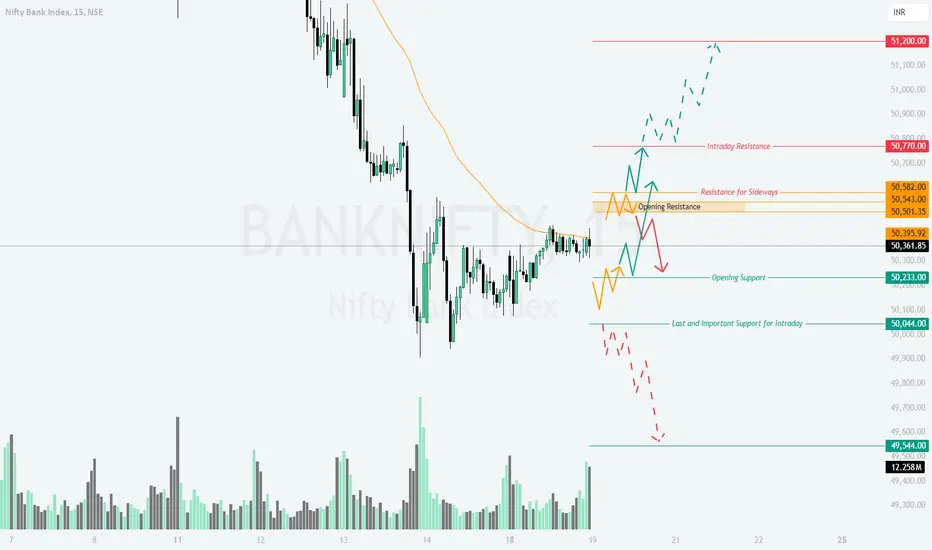
On 18-Nov-2024, Bank Nifty exhibited a consolidation pattern with a sideways trend near the 50,350 zone, as marked by the yellow region. The price respected the Opening Support level while attempting to test the resistance near 50,582, hinting at an indecisive market. This suggests that participants are awaiting a breakout or breakdown for directional clarity.
The chart indicates a possible continuation of this behavior, with Green Trendlines reflecting bullish scenarios and Red Trendlines pointing towards bearish outcomes. The Yellow Zone marks areas of consolidation or sideways movement.
Detailed Trading Plan for 19-Nov-2024
1. Gap Up Opening (200+ Points Above 50,500)
If Bank Nifty opens with a gap up near 50,770:
Scenario 1 (Bullish Continuation): A sustained move above 50,770 with strong volumes could target 51,200, the last intraday resistance. Consider entering long trades above 50,800, with a stop-loss at 50,582.
Scenario 2 (Pullback): Failure to sustain above 50,770 may lead to a pullback towards 50,582, the resistance-turned-support zone. Avoid aggressive longs unless a reversal pattern forms here.
2. Flat Opening (Near 50,395)
If Bank Nifty opens flat:
Scenario 1 (Bullish Move): A breakout above 50,582 with a retest and confirmation can lead to upside momentum toward 50,770. Look for a long entry near 50,600, with a stop-loss below 50,500.
Scenario 2 (Bearish Breakdown): A failure to hold 50,395 could lead to a decline toward 50,233, followed by 50,044. Enter short positions below 50,350, with a stop-loss at 50,450.
3. Gap Down Opening (200+ Points Below 50,233)
If Bank Nifty opens with a gap down near 50,044:
Scenario 1 (Bearish Continuation): Sustained selling pressure could drag the index toward 49,544, a key support zone. Consider shorting below 50,000, with a stop-loss above 50,150.
Scenario 2 (Reversal): A reversal from 50,044 with strong buying signals may push the index back to 50,233 or higher. Look for a long entry only after confirmation.
Risk Management Tips for Options Trading
Position Sizing: Limit exposure to 2-3% of your capital per trade. Avoid overleveraging, especially in volatile conditions.
Stop-Loss Discipline: Always maintain stop-losses, especially in options where time decay and volatility can lead to quick losses.
Avoid Mid-Day Trades: Prices often consolidate during mid-session; prefer trades during opening or toward the closing hours for higher conviction.
Summary & Conclusion
The critical levels to watch on 19-Nov-2024 are:
Resistance Zones: 50,582, 50,770, and 51,200.
Support Zones: 50,233, 50,044, and 49,544.
Bank Nifty is at a crucial juncture where a decisive breakout or breakdown can establish the trend. Trade cautiously and wait for confirmation near these levels before initiating trades.
Disclaimer
I am not a SEBI-registered analyst. The views shared here are based on my personal analysis and are intended for educational purposes only. Please consult with your financial advisor before making any trading decisions.
BANKNIFTY CHoCH in 30min and 45 min TFBanknifty has given a choch in 30min and 45 mins timeframe, it may go towards equilibrium around 51200-51300 and then fall again

Bank Nifty Live Analysis in 15 mintHello Friends As you can see in 15 mint Chart market making triangle if market breakout up site after retest you can short in case market breakout down site then after confirmation you can short I hope you like my idea thank you and God bless you.

Bank Nifty Triangle Nifty Bank has formed a triangle pattern, and the downside breakout can test the 50% retracement level (49750). Plan your trades accordingly.
For Educational and Paper Trading Purposes only.

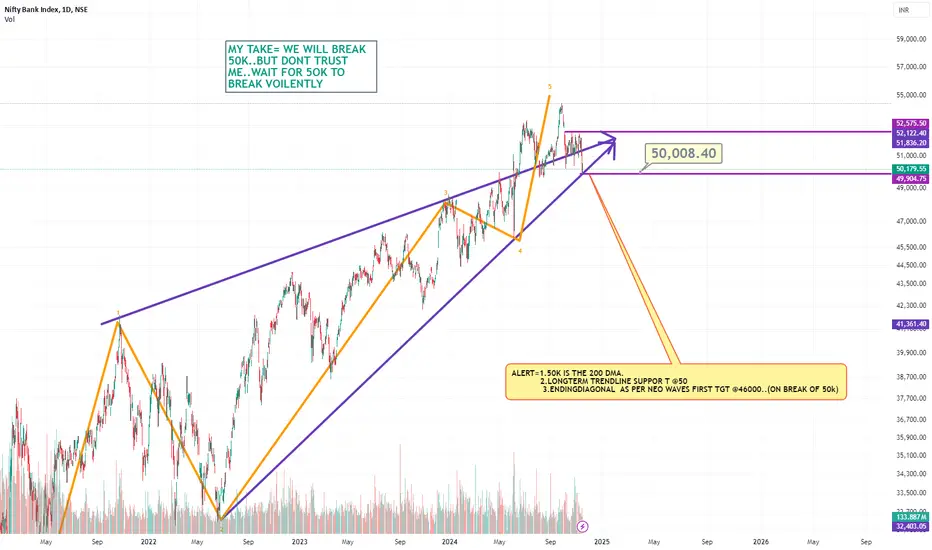
BN - Start of week Pre Market Report - 18 Nov to 22nd Nov 2024Like, Nifty Bank Nifty also continues to be Bearish. However, here the fall is quite distinct after being in a channel. (Refer to my Nifty Pre market report).
BN has broken that channel and now the next support could be in the form of the Daily Trend line as shown.
Presently, the 200 DEMA could act as a mild support.
For the current week, I expect BN to be range bound between 52,177 and 49,300 (The previous Weeks range).
Large trending moves could happen intraday only but overall, it could just remain range bound for the week.
Stay tuned for intraday updates on good set ups.

[INTRADAY] #BANKNIFTY PE & CE Levels(18/11/2024)Today will be flat opening or slightly gap down opening expected in banknifty. After opening banknifty will trade in between 50050-50450 important levels. If banknifty gives breakdown and starts trading below 49950 level then sharp downside rally expected in market. Bullish movement expected if banknifty starts trading and sustain above 50550 level.

BANKNIFTY: INSTITUTIONAL LEVELS FOR 18/11/2024Overview
This trading system combines simplicity with powerful insights for accurate entries and exits. It is structured for active traders using the 5-minute timeframe who want to make clear, confident trading decisions in fast-moving markets.
Key Strategy Guidelines
Retest Entries : Aim to enter trades on retests rather than breakouts, offering better positioning.
Multiple Confirmations : Use more than one confirmation to validate each trade, helping avoid impulsive decisions.
ATM Options Focus : Stick to at-the-money (ATM) options or above for optimal liquidity and manageable risk.
System Explanation
This setup leverages volume, historical price action, and price ranges to pinpoint high-probability entry and exit points. This methodology is designed to reduce guesswork, allowing traders to manage trades with a consistent approach.
How It Works: Entry/Exit Signals
Blue Line : Signals potential long entry.
Red Line : Indicates potential short entry.
Tip : Align these signals with additional confirmations from your trading strategy for optimal performance.
Stop Loss and Take Profit Levels
Stop Loss:
Long Trades : Set your stop loss at the nearest red line below the entry point, or adjust based on whether the 5-minute candle crosses the red line.
Short Trades : Use the blue line above as the stop loss.
Take Profit:
Long Entries :Target the next red line above or exit if other indicators suggest a prudent exit.
Short Entries :Target the next blue line below following similar guidelines.
Timeframe Recommendation
This system is specifically optimized for the 5-minute timeframe, making it suitable for those trading shorter intervals with precision.
Risk Disclaimer
Trading involves high risk, and rapid price changes can lead to unexpected losses. Only trade with capital you can afford to lose, and carefully assess your financial situation and risk tolerance.
Join the Community Discussion
Engage with other traders to discuss strategies, share insights, and enhance your understanding of the markets. Let’s grow together as a community of traders.
Original Content
This trading system is the product of my own expertise and rigorous testing. It’s a unique approach developed through real market experience to offer a clear edge in trading.

BANKNIFTY .OUTLOOK BearishPlease see the chart ..I have clearly given the 3 reasons ,Why 50k is the support break of which will see BN and Nifty tank...so fingers crossed..This is not a prediction ,,But an observation..Everything is written on the charts to make u understand..
BANKNIFTY : Trading Levels and Plan for 18-Nov-2024Bank Nifty Trading Plan for 18-Nov-2024
Previous Day Overview:
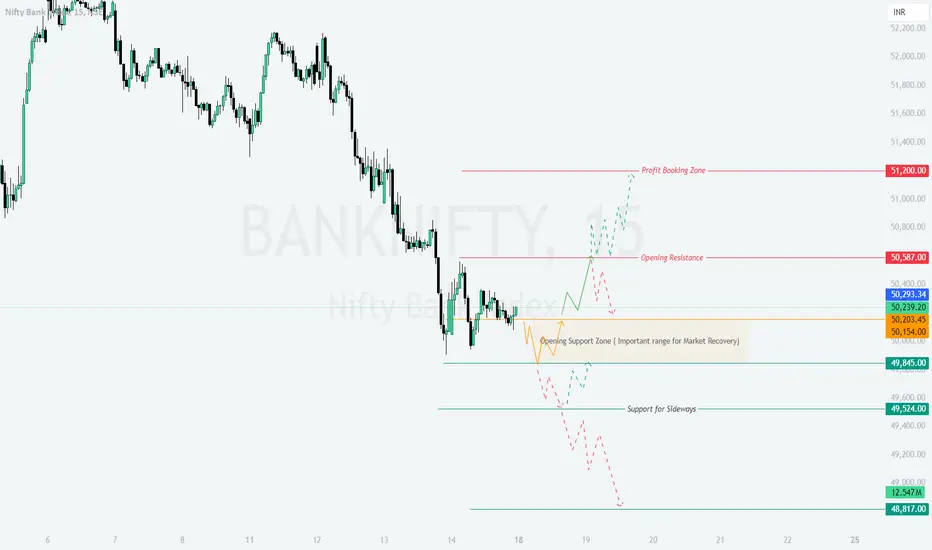
On 14-Nov-2024, Bank Nifty displayed a cautious trading pattern with a consolidative movement in the support zone, indicating a potential recovery phase. The trend analysis highlights the possible bullish sentiment, yet Bank Nifty is still facing resistance. The yellow area depicts a sideways trend , green represents a bullish trend , and red shows a bearish trend .
---
Opening Scenarios:
Gap Up Opening (200+ points above)
If Bank Nifty opens above 50,587, indicating a strong upward momentum, focus on the 51,200 level as a Profit Booking Zone . Wait for price stability in the first 15-30 minutes; a consolidation around 50,800 could provide a buying opportunity with a target towards the profit booking zone. However, avoid aggressive entry if there’s excessive volatility.
Flat Opening (within ±50 points)
A flat opening near 50,200 could be ideal for assessing early market sentiment. If Bank Nifty sustains above the 50,239 level, there’s potential for a bullish continuation towards 50,587. Monitor any pullbacks to the Opening Support Zone (50,154) as a possible re-entry point for upward movement.
Gap Down Opening (200+ points below)
A gap-down opening near 49,845 may indicate a weaker market sentiment, with 49,524 acting as a critical support level. In this scenario, consider holding off trades in the initial 30 minutes, allowing the market to find stability. If Bank Nifty sustains below 49,845, the trend could shift bearish, with the support zone around 48,817 offering potential support.
---
Risk Management Tips for Options Trading:
- Limit exposure in high volatility environments, especially near significant support and resistance levels.
- Consider using stop-loss levels based on hourly candle closes to avoid sharp fluctuations.
- Position sizing should be conservative if the market opens with a gap, as it may cause rapid swings.
---
Summary & Conclusion :
Today's session may present opportunities if Bank Nifty opens near key support or resistance levels. Patience is essential, with emphasis on watching the 50,154 support and 50,587 resistance for potential breakouts. The overall sentiment appears cautiously bullish, with sideways and bearish patterns also in consideration depending on the market’s opening position.
---
Disclaimer:
I am not a SEBI-registered analyst. This trading plan is shared for educational purposes only, and individuals should conduct their own analysis or consult a financial advisor before making trading decisions.
Bank Nifty LongBank Nifty- Set ups
MTF Analysis Proximal Distal Average
Bank Nifty Yearly Demand Beakout 41829 29687 35758
Bank Nifty 6 Month Demand 44787 38613 41700
Bank Nifty Qtrly Demand Breakout 48450 44429 46440
Bank Nifty Monthly Demand BUFL 48161 44429 46295
Bank Nifty Weekly Demand DMIP 46990 45828 46409
Bank Nifty Daily Demand DMIP DMIP 49960 49654 49807
ENTRY -1 49960
ENTRY -2 49000
Average 49480
SL 48484
RISK 996
Target-1 54000
Target-2 61000
Average 57500
Points to Gain 8,020
RR 8

BankNifty 48750 Next Week?Looks like bears are going to crash down to 48750 :|
Sabke levels niklenge :D

bank nifty analysis bank nifty fibonacci retracement, gann square of 144 lines , gann fan all indicates the same low of election result day. nifty may fall to gann 144 level 49354.40 on 16 july 2024.

banknifty one hour chart daily time analysis banknifty chart . first down wave A and Wave B Price move upside a,b,c,d or e and again Wave C downfall . Wave C internal 1,2,3,4 or 5

Banknifty elliot wave analysis daily time analysis banknifty chart . first down wave A and Wave B Price move upside a,b,c,d or e and again Wave C downfall . Wave C internal 1,2,3,4 or 5


Will BankNifty Reclaim 52000?My analysis is saying that BankNifty is going to reclaim 52000 pretty soon. What do you think?

BANK NIFTY S/R for 18/11/24Support and Resistance Levels:
Support Levels: These are price points (green line/shade) where a downward trend may be halted due to a concentration of buying interest. Imagine them as a safety net where buyers step in, preventing further decline.
Resistance Levels: Conversely, resistance levels (red line/shade) are where upward trends might stall due to increased selling interest. They act like a ceiling where sellers come in to push prices down.
Breakouts:
Bullish Breakout: When the price moves above resistance, it often indicates strong buying interest and the potential for a continued uptrend. Traders may view this as a signal to buy or hold.
Bearish Breakout: When the price falls below support, it can signal strong selling interest and the potential for a continued downtrend. Traders might see this as a cue to sell or avoid buying.
20 EMA (Exponential Moving Average):
Above 20 EMA(50 EMA): If the stock price is above the 20 EMA, it suggests a potential uptrend or bullish momentum.
Below 20 EMA: If the stock price is below the 20 EMA, it indicates a potential downtrend or bearish momentum.
Trendline: A trendline is a straight line drawn on a chart to represent the general direction of a data point set.
Uptrend Line: Drawn by connecting the lows in an upward trend. Indicates that the price is moving higher over time. Acts as a support level, where prices tend to bounce upward.
Downtrend Line: Drawn by connecting the highs in a downward trend. Indicates that the price is moving lower over time. It acts as a resistance level, where prices tend to drop.
RSI: RSI readings greater than the 70 level are overbought territory, and RSI readings lower than the 30 level are considered oversold territory.
Combining RSI with Support and Resistance:
Support Level: This is a price level where a stock tends to find buying interest, preventing it from falling further. If RSI is showing an oversold condition (below 30) and the price is near or at a strong support level, it could be a good buy signal.
Resistance Level: This is a price level where a stock tends to find selling interest, preventing it from rising further. If RSI is showing an overbought condition (above 70) and the price is near or at a strong resistance level, it could be a signal to sell or short the asset.
Disclaimer:
I am not a SEBI registered. The information provided here is for learning purposes only and should not be interpreted as financial advice. Consider the broader market context and consult with a qualified financial advisor before making investment decisions.

BANK NIFTY WEEKLY VIEW - ( November 3th week analysis )Nifty bank is neutral right now , no clear bearish signal yet but upside looks tough . 49767 is very important support and if banknifty breaches this level then we can expect it to retrace upto 48950. But if banknifty crosses 50650 then we can expect further upside upto 51400.
