Bank Nifty - Pre Market Report 14 NovBN after the considerable fall yesterday has now reached a vital Monthly Support Zone which also has a strong confluence with the 200 DEMA.
There was some last minute buying activity that happened yesterday which would mostly have been profit booking for all short positions.
Today, my view is that BN could remain in sideways territory after the great fall. In fact, if it gaps down, my suggestion is to not short.
Intraday directional players should rather stay out today.
Also, there is a probability of a long reversal on BN in the next couple of sessions. So there should definitely be a wait and watch approach. Shorting BN at this stage could lead to a trap for the Bears.
Once there is a price action confirmation, decide for a Long View or a further short view.
If the market has to go down even more, it would reverse first on the upside, take all the Long positions and then most likely you might encounter a complete Bearish day which will set the tone for further lower levels.
BANKNIFTY trade ideas

[INTRADAY] #BANKNIFTY PE & CE Levels(14/11/2024)Today will be slightly gap up opening expected in banknifty. After opening possible it will face immediate resistance at 50450 level and from this level expected downside in market. This downside can extend further 400-500 points if banknifty starts trading below 49950 level. Upside only expected in case it starts trading and sustain above 50550 level in today's session.

BANKNIFTY: INSTITUTIONAL LEVELS FOR 14/11/2024Overview
This trading system combines simplicity with powerful insights for accurate entries and exits. It is structured for active traders using the 5-minute timeframe who want to make clear, confident trading decisions in fast-moving markets.
Key Strategy Guidelines
Retest Entries : Aim to enter trades on retests rather than breakouts, offering better positioning.
Multiple Confirmations : Use more than one confirmation to validate each trade, helping avoid impulsive decisions.
ATM Options Focus : Stick to at-the-money (ATM) options or above for optimal liquidity and manageable risk.
System Explanation
This setup leverages volume, historical price action, and price ranges to pinpoint high-probability entry and exit points. This methodology is designed to reduce guesswork, allowing traders to manage trades with a consistent approach.
How It Works: Entry/Exit Signals
Blue Line : Signals potential long entry.
Red Line : Indicates potential short entry.
Tip : Align these signals with additional confirmations from your trading strategy for optimal performance.
Stop Loss and Take Profit Levels
Stop Loss:
Long Trades : Set your stop loss at the nearest red line below the entry point, or adjust based on whether the 5-minute candle crosses the red line.
Short Trades : Use the blue line above as the stop loss.
Take Profit:
Long Entries :Target the next red line above or exit if other indicators suggest a prudent exit.
Short Entries :Target the next blue line below following similar guidelines.
Timeframe Recommendation
This system is specifically optimized for the 5-minute timeframe, making it suitable for those trading shorter intervals with precision.
Risk Disclaimer
Trading involves high risk, and rapid price changes can lead to unexpected losses. Only trade with capital you can afford to lose, and carefully assess your financial situation and risk tolerance.
Join the Community Discussion
Engage with other traders to discuss strategies, share insights, and enhance your understanding of the markets. Let’s grow together as a community of traders.
Original Content
This trading system is the product of my own expertise and rigorous testing. It’s a unique approach developed through real market experience to offer a clear edge in trading.

BankNifty Support and Resistance Levels For 14th Nov 2024I’ve created a chart highlighting the key support and resistance levels for #BankNifty, designed to help traders make informed decisions.
These levels provide critical insights for understanding potential price movements, enabling traders to identify ideal entry and exit points.
Use these levels to gain a clearer perspective on Sensex trends and optimize your trades with greater confidence.
Remember, these levels serve as guidance, so always combine them with your own analysis and risk management.

BANK NIFTY S/R for 14/11/24Support and Resistance Levels:
Support Levels: These are price points (green line/shade) where a downward trend may be halted due to a concentration of buying interest. Imagine them as a safety net where buyers step in, preventing further decline.
Resistance Levels: Conversely, resistance levels (red line/shade) are where upward trends might stall due to increased selling interest. They act like a ceiling where sellers come in to push prices down.
Breakouts:
Bullish Breakout: When the price moves above resistance, it often indicates strong buying interest and the potential for a continued uptrend. Traders may view this as a signal to buy or hold.
Bearish Breakout: When the price falls below support, it can signal strong selling interest and the potential for a continued downtrend. Traders might see this as a cue to sell or avoid buying.
20 EMA (Exponential Moving Average):
Above 20 EMA(50 EMA): If the stock price is above the 20 EMA, it suggests a potential uptrend or bullish momentum.
Below 20 EMA: If the stock price is below the 20 EMA, it indicates a potential downtrend or bearish momentum.
Trendline: A trendline is a straight line drawn on a chart to represent the general direction of a data point set.
Uptrend Line: Drawn by connecting the lows in an upward trend. Indicates that the price is moving higher over time. Acts as a support level, where prices tend to bounce upward.
Downtrend Line: Drawn by connecting the highs in a downward trend. Indicates that the price is moving lower over time. It acts as a resistance level, where prices tend to drop.
RSI: RSI readings greater than the 70 level are overbought territory, and RSI readings lower than the 30 level are considered oversold territory.
Combining RSI with Support and Resistance:
Support Level: This is a price level where a stock tends to find buying interest, preventing it from falling further. If RSI is showing an oversold condition (below 30) and the price is near or at a strong support level, it could be a good buy signal.
Resistance Level: This is a price level where a stock tends to find selling interest, preventing it from rising further. If RSI is showing an overbought condition (above 70) and the price is near or at a strong resistance level, it could be a signal to sell or short the asset.
Disclaimer:
I am not a SEBI registered. The information provided here is for learning purposes only and should not be interpreted as financial advice. Consider the broader market context and consult with a qualified financial advisor before making investment decisions.

Dont sell Banknifty until it breaks 49400 52600 to 52350 is the supply zone on 1h chart
we seen a rejection from that zone later we found price drops nicely from from bearish fvg
currently price is almost near to the demand zone which is at the level of 50800 to 50450
but i have to choose the pin point one level i will go with 50560 will be the area where we should wait and seek a bullish pattern or structure shift
if the price successfully hold the 50560 level we can assume that the 49400 level is going to be base formation and target towards upside around 53250
as of todays market close we dont have good space downside to get momentum short side rather than waiting for bullish impulse move

BANKNIFTY KEY LEVELS FOR 14/11/2024**Explanation:**
This trading system helps you avoid blind trades by providing confirmation for better entries and exits. It considers volume, past prices, price range and indiavix.
**Entry/Exit Points:**
- **Entry/Exit Lines:** Use the BLACK line for long trades and the RED line for short trades, based on confirmation from your trading plan.
- **Stop Loss:** For long trades, set the stop loss at the RED line below. For short trades, set it at the BLACK line above.
- **Take Profit:** For long trades, target the next RED line above. For short trades, target the next BLACK line below.
**Timeframe:**
Use a 5 timeframe for trading.
**Risk Disclaimer:**
This setup is for educational purposes. I'm not responsible for your gains or losses. Check the chart for more details.

banknifty analysis-"Bank Nifty, after reaching its all-time high of 54,338, has faced significant downward pressure. A low of 49,904 was recorded, marking a decline of approximately 8%. The index is currently testing a critical support level at the 200-EMA. A decisive break below this level could signal further downside potential. We will closely monitor price action and indicators for signs of a potential reversal."

BANKNIFTY TRAPToday is last weekly expiry of the BANKNIFTY.
I think they are going to trap all seller in today's expiry.
Short should be brought down to escape from this trap.
Not recommending to buy in any means ....!
We have done the D leg down of a triangle....an explosive move for E can anytime resume...!
Regards

BANKNIFTY Weekly Analysis // Reversal or Breakdown?www.tradingview.com
Everyone has seen a severe breakdown in BankNifty in recent day and more than 10% correction. But hey, wait a minute.
Did you checked the level where it is holding right now?
It is the same level from where it has reverted several times in past. Meaning, we can consider it as a strong buying zone.
Along with the above, it is also a level where 38% retracement is there from Fibonacci retracement perspective.
Consider the level of support at 49700, if BankNifty doesn't goes below from here next week, be ready for a resume of bull run again.
So, the next resistance will be : 54400, 57500, 60500, 63600
and, the support will be : 48200, 46800, 45800.
So, wait for the end of the current weekly candle. If you could see there are approx 5 divergence too on weekly candle which suggest change in situation.
Good luck.
Thanks
StoxWare team

$BANKNIFTY RSI stoch bottomed out
approaching 50 ema and liquidity pocket sup range high made in june 2024
so either we bounce here on the 3rd tap or a fair way down from here
ready for both scenarios would prefer the former 3 tap to play out
thoughts on Dollar being strong af since Trump came in for now has tagged 106.1 which is heavy supply lets see if we deviate back down from here
which would obviously give us some relief

Goodbye BankNifty Weekly - A Memorable Last TradeToday marks the end of an era as we bid farewell to Bank Nifty weekly options, with November 13, 2024, being the final trading session under NSE’s revised framework.
Bank Nifty has been a favorite for traders, offering unmatched volatility and opportunities.
And what better way to say goodbye than with a stellar 1000+ points profit on this final short trade?
The Final Goodbye BankNifty Weekly Trade
Instrument: Bank Nifty (Weekly Options)
Direction: Short
Gain: Over 1000 points in just one day of trading
Technical Overview
This short trade capitalized on the beautifully bearish momentum that Bank Nifty gifted us on its final day.
With precision execution, traders were able to extract significant profits, as seen on the attached chart.
The steep decline reflects the perfect synergy between market structure, Risological indicator confirmation , and trading strategy.
The visualized Risological red resistance bands acted as a strong guide for trend continuation, with the price respecting these levels while making lower highs and lower lows. A textbook downtrend to close this chapter.
A Legacy Remembered
Bank Nifty weekly options have been instrumental in shaping intraday trading strategies, providing immense liquidity and opportunities. For years, it has been a go-to index for traders seeking action-packed sessions and quick profits.
Looking Forward
As we close this chapter, we eagerly await how the markets evolve under NSE’s new framework.
One thing remains certain: the spirit of Bank Nifty’s action will live on in the strategies, lessons, and profits it has delivered to traders.
Thank you, Bank Nifty Weekly, for the thrills, challenges, and unforgettable memories. You will be missed.
#BankNifty #GoodbyeWeeklyOptions #1000PointsProfit #TradingView

[INTRADAY] #BANKNIFTY PE & CE Levels(13/11/2024)Today will be flat opening expected in banknifty. After opening if banknifty starts trading below 50950 level then possible strong downside fall of 400-500 occurs in index. Downside 50550 will act as a support for today's session. Upside 51450 is the resistance level, if any upside rally above 51050 level will face this resistance and possible reversal from this level.

BANKNIFTY: INSTITUTIONAL LEVELS FOR 13/11/2024🔍 Overview
This trading system combines simplicity with powerful insights for accurate entries and exits. It’s structured for active traders using the 5-minute timeframe who want to make clear, confident trading decisions in fast-moving markets.
📌 Key Strategy Guidelines
🔄 Retest Entries: Aim to enter trades on retests rather than breakouts for better positioning.
✅ Multiple Confirmations: Use more than one confirmation to validate each trade, helping avoid impulsive decisions.
💰 ATM Options Focus: Stick to at-the-money (ATM) options or above for optimal liquidity and manageable risk.
📖 System Explanation
This setup leverages volume, historical price action, and price ranges to pinpoint high-probability entry and exit points. This methodology is designed to reduce guesswork, allowing traders to manage trades with a consistent approach.
📉 How It Works: Entry/Exit Signals
🔵 Blue Line: Signals potential long entry.
🔴 Red Line: Indicates potential short entry.
💡 Tip: Align these signals with additional confirmations from your trading strategy for optimal performance.
📊 Stop Loss and Take Profit Levels
🛑 Stop Loss:
Long Trades: Set your stop loss at the nearest red line below the entry point, or adjust based on whether the 5-minute candle crosses the red line.
Short Trades: Use the blue line above as the stop loss.
🎯 Take Profit:
Long Entries: Target the next red line above or exit if other indicators suggest a prudent exit.
Short Entries: Target the next blue line below, following similar guidelines.
⏰ Timeframe Recommendation
This system is specifically optimized for the 5-minute timeframe, making it suitable for those trading shorter intervals with precision.
⚠️ Risk Disclaimer
Trading involves high risk, and rapid price changes can lead to unexpected losses. Only trade with capital you can afford to lose, and carefully assess your financial situation and risk tolerance.
👥 Join the Community Discussion
Engage with other traders to discuss strategies, share insights, and enhance your understanding of the markets. Let’s grow together as a community of traders! 🌐
✨ Original Content
This trading system is the product of my own expertise and rigorous testing. It’s a unique approach developed through real market experience to offer a clear edge in trading.

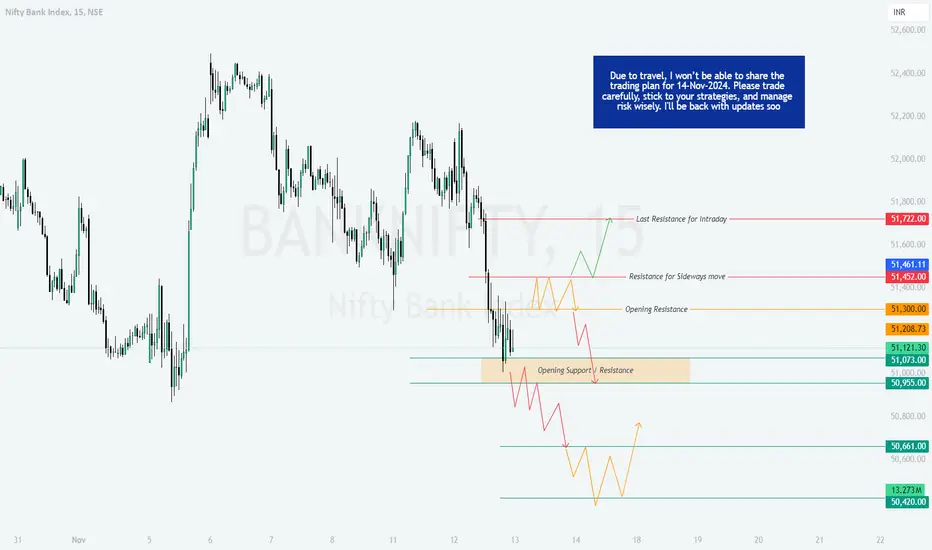
BANKNIFTY : Levels and Plan for 13-Nov-2024
On 12-Nov-2024 , Bank Nifty displayed downtrend movement around the "Opening Support / Resistance" level, with the index facing resistance near 51,300 . This suggests a strong supply zone in this area. Going forward, we will watch for potential breakout or breakdown levels based on key resistance and support zones identified on the chart.
---
Trading Plan for 13-Nov-2024
Gap Up Opening (200+ points):
If Bank Nifty opens with a significant gap up above 51,461 , monitor for initial resistance near 51,722 (Last Resistance for Intraday). Sustained movement above this level could lead to further upside, with potential targets around 52,000 in intraday trading. However, if the index fails to hold above 51,722 , expect a pullback towards 51,300 (Opening Resistance) where bulls might attempt to defend.
Flat Opening:
For a flat opening near 51,121 , watch for initial reactions at 51,300 . If Bank Nifty sustains above this level, it could test the "Resistance for Sideways Move" zone at 51,461 . A breakout above 51,461 could push the index towards 51,722 , whereas failure to sustain above 51,300 may indicate weakness, leading to a retest of the "Opening Support" zone around 51,073 .
Gap Down Opening (200+ points):
A gap down opening below 51,073 would place Bank Nifty in the "Opening Support" zone. If buying interest appears, the index could attempt a recovery towards 51,300 . Failure to sustain above 51,073 could lead to further downside, targeting 50,955 and possibly moving towards the lower support zone around 50,661 (Potential Bottom Support).
---
Risk Management Tips for Options Trading:
- Limit your exposure during high volatility by adjusting position sizes accordingly, particularly near resistance and support zones.
- Use hourly close levels for stop-losses to avoid being whipsawed by intraday fluctuations.
- Avoid trading during unclear or range-bound movements (indicated by Yellow zones) as these areas are more prone to reversals and may impact risk-reward balance.
---
Summary & Conclusion:
For 13-Nov-2024 , the key levels to monitor include 51,722 on the upside for resistance and 50,955 for potential support on the downside. Sideways trends are highlighted in Yellow, bullish areas in Green, and bearish regions in Red. Price action around the "Opening Resistance" and "Opening Support" zones will be crucial in determining the day’s directional bias.
---
Disclaimer: I am not a SEBI-registered analyst. This analysis is based on my personal trading strategy and psychological theory. Please perform your analysis or consult a financial advisor before making any trading decisions.
---
Happy Trading!
Bank Nifty Index Analysis: Key Levels and Target ZonesBank Nifty Index Analysis: Key Levels and Target Zones
Middle Control Point: 51,000
The middle control point, or the average level of 51,000, acts as a key psychological and technical level for Bank Nifty. This point serves as a pivot for potential upward or downward movements. If Bank Nifty sustains above or below this level, it may provide insight into the market's short-term direction.
Upper Target Level: 52,150
Scenario: If Bank Nifty sustains above 51,000, it indicates bullish momentum.
Target: The first potential upside target would be 52,150.
Significance: A sustained move above 51,000 with strong buying interest could suggest a continuation of the bullish trend, making 52,150 the next resistance or profit-taking level. This level could attract sellers or profit-booking by traders, so it’s essential to watch for any reversal signals as it nears 52,150.
Down Target Level: 50,390
Scenario: If Bank Nifty breaks and sustains below 51,000, it indicates bearish pressure.
Target: The first downside target would be 50,390.
Significance: A sustained move below 51,000 could signal weakness, potentially leading to a decline towards 50,390. This level could act as a support zone where buyers may look to re-enter, or it could also act as a potential breakdown point for further downside, depending on the strength of selling momentum.
Summary:
Control Point : 51,000 (average level, pivot for bullish or bearish sentiment).
Bullish Scenario : Above 51,000 – Targeting 52,150.
Bearish Scenario : Below 51,000 – Targeting 50,390.
These levels should be monitored along with other market indicators, news events, and broader market sentiment for a comprehensive analysis of Bank Nifty.

BankNifty 49700?Ideally if you see the trend it is making a bearish breakdown, so only a gapup opening can save Banknifty, else I am clearly viewing Banknifty towards 49700!!

Trendlines over-synchronisation Huge opportunity tomorrow,
Sellers were strong today, neglecting support, trading in trendlines, hope for the best tomorrow

BANK NIFTY S/R for 13/11/24Support and Resistance Levels:
Support Levels: These are price points (green line/shade) where a downward trend may be halted due to a concentration of buying interest. Imagine them as a safety net where buyers step in, preventing further decline.
Resistance Levels: Conversely, resistance levels (red line/shade) are where upward trends might stall due to increased selling interest. They act like a ceiling where sellers come in to push prices down.
Breakouts:
Bullish Breakout: When the price moves above resistance, it often indicates strong buying interest and the potential for a continued uptrend. Traders may view this as a signal to buy or hold.
Bearish Breakout: When the price falls below support, it can signal strong selling interest and the potential for a continued downtrend. Traders might see this as a cue to sell or avoid buying.
20 EMA (Exponential Moving Average):
Above 20 EMA(50 EMA): If the stock price is above the 20 EMA, it suggests a potential uptrend or bullish momentum.
Below 20 EMA: If the stock price is below the 20 EMA, it indicates a potential downtrend or bearish momentum.
Trendline: A trendline is a straight line drawn on a chart to represent the general direction of a data point set.
Uptrend Line: Drawn by connecting the lows in an upward trend. Indicates that the price is moving higher over time. Acts as a support level, where prices tend to bounce upward.
Downtrend Line: Drawn by connecting the highs in a downward trend. Indicates that the price is moving lower over time. It acts as a resistance level, where prices tend to drop.
RSI: RSI readings greater than the 70 level are overbought territory, and RSI readings lower than the 30 level are considered oversold territory.
Combining RSI with Support and Resistance:
Support Level: This is a price level where a stock tends to find buying interest, preventing it from falling further. If RSI is showing an oversold condition (below 30) and the price is near or at a strong support level, it could be a good buy signal.
Resistance Level: This is a price level where a stock tends to find selling interest, preventing it from rising further. If RSI is showing an overbought condition (above 70) and the price is near or at a strong resistance level, it could be a signal to sell or short the asset.
Disclaimer:
I am not a SEBI registered. The information provided here is for learning purposes only and should not be interpreted as financial advice. Consider the broader market context and consult with a qualified financial advisor before making investment decisions.

BankNifty Support and Resistance Levels For 13th Nov 2024I’ve created a chart highlighting the key support and resistance levels for #BankNifty, designed to help traders make informed decisions.
These levels provide critical insights for understanding potential price movements, enabling traders to identify ideal entry and exit points.
Use these levels to gain a clearer perspective on Sensex trends and optimize your trades with greater confidence.
Remember, these levels serve as guidance, so always combine them with your own analysis and risk management.

Tmrw expiry banknifty case 1- consolidation ; time decay ;
case 2 - Demand zone ; expecting a reversal with double;
case 3 - may see another round after pull back

Nifty & Bank Nifty Analysis & Trade Plan for 13th NovemberNifty & Bank Nifty Analysis & Trade Plan for 13th November

BANKNIFTY Bears Bag 550+ Points! Intraday Targets CrushedBANKNIFTY Intraday Short Trade Analysis:
The BANKNIFTY 15m timeframe delivered a stellar short trade setup, hitting all targets and locking in 550+ points profit with impeccable precision. This move stands out as a textbook bearish trade, leveraging strong downward momentum.
Indicators used: Risological Swing Trader and Risological Trading Indicator
Trade Details:
Entry: 51957.20
Stop Loss (SL): 52051.90
Targets:
TP1: 51840.20 ✅
TP2: 51650.85 ✅
TP3: 51461.50 ✅
TP4: 51344.45 ✅
Key Takeaways:
Massive Profit Potential: BANKNIFTY's bearish momentum resulted in a swift 550+ points profit – a dream trade for intraday option traders.
Red-Hot Momentum Indicators : The cascading red candles confirmed the sustained selling pressure, ensuring that all targets were achieved effortlessly.
High Accuracy : Entry aligned perfectly with the resistance from the EMA ribbon, signaling a strong rejection and bearish continuation.
Profit Perspective:
This trade stands as a hallmark of precision and efficiency, showcasing the power of accurate technical analysis in volatile markets like BANKNIFTY. Such trades exemplify how disciplined execution can lead to exceptional intraday gains.
Conclusion:
The BANKNIFTY short trade played out to perfection, reinforcing the value of spotting momentum-driven opportunities. With more than 550+ points secured, this setup remains one of the most lucrative intraday plays of the session!
Namaste!
