[INTRADAY] #BANKNIFTY PE & CE Levels(12/11/2024)Today will be flat or slightly gap up opening expected in banknifty near 52000 level. Strong bullish rally expected if banknifty starts trading and sustain above 52050 level. If banknifty opened below 51950 level then after opening it will face strong resistance at this level. Downside 51550 will act as a crucial support for today's session. Major downside expected if banknifty starts trading below 51450 level.
BANKNIFTY trade ideas

BANKNIFTY: INSTITUTIONAL LEVELS FOR 12/11/2024Overview
This trading system combines simplicity with powerful insights for accurate entries and exits. It is structured for active traders using the 5-minute timeframe who want to make clear, confident trading decisions in fast-moving markets.
Key Strategy Guidelines
Retest Entries : Aim to enter trades on retests rather than breakouts, offering better positioning.
Multiple Confirmations : Use more than one confirmation to validate each trade, helping avoid impulsive decisions.
ATM Options Focus : Stick to at-the-money (ATM) options or above for optimal liquidity and manageable risk.
System Explanation
This setup leverages volume, historical price action, and price ranges to pinpoint high-probability entry and exit points. This methodology is designed to reduce guesswork, allowing traders to manage trades with a consistent approach.
How It Works: Entry/Exit Signals
Blue Line : Signals potential long entry.
Red Line : Indicates potential short entry.
Tip : Align these signals with additional confirmations from your trading strategy for optimal performance.
Stop Loss and Take Profit Levels
Stop Loss:
Long Trades : Set your stop loss at the nearest red line below the entry point, or adjust based on whether the 5-minute candle crosses the red line.
Short Trades : Use the blue line above as the stop loss.
Take Profit:
Long Entries :Target the next red line above or exit if other indicators suggest a prudent exit.
Short Entries :Target the next blue line below following similar guidelines.
Timeframe Recommendation
This system is specifically optimized for the 5-minute timeframe, making it suitable for those trading shorter intervals with precision.
Risk Disclaimer
Trading involves high risk, and rapid price changes can lead to unexpected losses. Only trade with capital you can afford to lose, and carefully assess your financial situation and risk tolerance.
Join the Community Discussion
Engage with other traders to discuss strategies, share insights, and enhance your understanding of the markets. Let’s grow together as a community of traders.
Original Content
This trading system is the product of my own expertise and rigorous testing. It’s a unique approach developed through real market experience to offer a clear edge in trading.

BankNifty Index AnalysisBankNifty Index Analysis for 12/11/2024 [ /b]
Control Point: 51,800
The Control Point at 51,800 represents a critical zone where market participants may observe significant support and resistance levels. This area serves as a balance point between bullish and bearish sentiment, and its behavior can offer insights into potential future movements. A sustained position above this level could indicate market strength, while slipping below might hint at potential weakness.
Upside Target: 52,450
The Upside Target at 52,450 suggests a potential area of resistance that bulls may aim for if BankNifty sustains momentum above the Control Point. Reaching this level would likely indicate strong buying interest, especially if the index moves swiftly past intermediate resistance points. Traders looking for bullish entry opportunities may consider using pullbacks towards the Control Point as potential buying zones, with the aim of reaching this target.
Downside Target: 51,300
The Downside Target at 51,300 represents a support level where bearish momentum may find it challenging to push further down. If BankNifty moves below the Control Point at 51,800 and approaches this level, it would signal a possible shift in sentiment toward weakness. If this level holds, it could serve as a buying opportunity for bulls seeking a rebound. However, a break below 51,300 could lead to increased selling pressure, potentially opening up further downside risk.
Conclusion
The BankNifty index is currently trading around a pivotal Control Point at 51,800. This level will likely act as a tipping point. Holding above it could lead to an upside target of 52,450, while breaking below it could signal movement toward the downside target of 51,300. Traders should monitor price action closely around these levels for possible entry and exit signals.

BANKNIFTY : Levels and Strategies for 12-Nov-2024Intro:
In the previous session, Bank Nifty experienced a range-bound movement, testing key levels. We observed sideways trends (yellow) near 51,733 - 51,812 , while bullish momentum (green) indicated potential breakout levels, and bearish moves (red) highlighted critical support areas. Watching these areas today can provide insights into possible market direction.
Opening Scenarios:
Gap Up Opening (200+ Points Above)
If Bank Nifty opens above the 51,893 level, it will likely face an intraday resistance at 52,316 . A breakout above this resistance could drive the price toward the profit-booking zone at 52,639 - 52,729 . A strong bullish move past 52,729 would indicate sustained buying pressure.
Traders can consider long positions upon a confirmed breakout above 52,316 , with targets at the higher resistance zones. However, if Bank Nifty struggles to maintain above 52,316 , it may signal a pullback toward the 51,893 level.
A cautious approach is recommended, with tight stop-losses for long trades in case of pullbacks.
Flat Opening
In a flat opening scenario around 51,812 , the immediate support and resistance zones to monitor are 51,733 (support) and 51,893 (resistance). Bank Nifty’s movement between these levels could lead to sideways trading (yellow zone).
A sustained breakout above 51,893 could indicate bullish momentum, leading towards the intraday resistance at 52,316 . Conversely, if Bank Nifty breaks below 51,733 , it may revisit lower levels near 51,480 .
Range-bound trades can be executed within this zone with tight stop-losses, especially if it shows sideways consolidation.
Gap Down Opening (200+ Points Below)
A gap down opening below 51,733 places Bank Nifty closer to the Opening Support and Buyer’s Zone at 51,480 . Buyers might show interest here, so a recovery could push the price back to 51,733 - 51,812 .
If the price holds above 51,480 and shows strength, a bounce-back opportunity is likely. However, if Bank Nifty breaks below 51,480 , it may fall toward the “Must Try Zone” at 51,073 - 50,955 , a critical buyer’s support level.
Conservative traders should wait for confirmation of a rebound or a breakdown before making any move in this scenario.
Risk Management Tips for Options Trading:
Follow a strict stop-loss approach based on defined levels ( 51,480 , 51,733 , 52,316 ) to reduce risk exposure.
Avoid over-leveraging and consider using options spreads to manage premium costs in volatile conditions.
Set realistic profit targets and trail stop-losses as the price moves in favor of your trade.
Be cautious around major support/resistance levels to avoid getting caught in potential reversals.
Summary and Conclusion:
Bank Nifty’s key levels for 12-Nov-2024 are 51,733 (opening support), 52,316 (intraday resistance), and 51,480 (critical support zone). Monitoring price reactions around these levels will guide intraday trends. Effective risk management in options trading can help mitigate potential losses in a volatile environment.
Disclaimer:
I am not a SEBI-registered analyst. This trading plan is based on technical patterns and personal insights. Traders are encouraged to conduct their own analysis or seek advice from a certified financial advisor before making any trading decisions.

BANK NIFTY S/R for 12/11/24Support and Resistance Levels:
Support Levels: These are price points (green line/shade) where a downward trend may be halted due to a concentration of buying interest. Imagine them as a safety net where buyers step in, preventing further decline.
Resistance Levels: Conversely, resistance levels (red line/shade) are where upward trends might stall due to increased selling interest. They act like a ceiling where sellers come in to push prices down.
Breakouts:
Bullish Breakout: When the price moves above resistance, it often indicates strong buying interest and the potential for a continued uptrend. Traders may view this as a signal to buy or hold.
Bearish Breakout: When the price falls below support, it can signal strong selling interest and the potential for a continued downtrend. Traders might see this as a cue to sell or avoid buying.
20 EMA (Exponential Moving Average):
Above 20 EMA(50 EMA): If the stock price is above the 20 EMA, it suggests a potential uptrend or bullish momentum.
Below 20 EMA: If the stock price is below the 20 EMA, it indicates a potential downtrend or bearish momentum.
Trendline: A trendline is a straight line drawn on a chart to represent the general direction of a data point set.
Uptrend Line: Drawn by connecting the lows in an upward trend. Indicates that the price is moving higher over time. Acts as a support level, where prices tend to bounce upward.
Downtrend Line: Drawn by connecting the highs in a downward trend. Indicates that the price is moving lower over time. It acts as a resistance level, where prices tend to drop.
RSI: RSI readings greater than the 70 level are overbought territory, and RSI readings lower than the 30 level are considered oversold territory.
Combining RSI with Support and Resistance:
Support Level: This is a price level where a stock tends to find buying interest, preventing it from falling further. If RSI is showing an oversold condition (below 30) and the price is near or at a strong support level, it could be a good buy signal.
Resistance Level: This is a price level where a stock tends to find selling interest, preventing it from rising further. If RSI is showing an overbought condition (above 70) and the price is near or at a strong resistance level, it could be a signal to sell or short the asset.
Disclaimer:
I am not a SEBI registered. The information provided here is for learning purposes only and should not be interpreted as financial advice. Consider the broader market context and consult with a qualified financial advisor before making investment decisions.

BankNifty Bearish?Banknifty will tomorrow probably show some downwards movement as it looks like, banknifty is trying to retest the levels below before an upward move, if banknifty turns out to be bullish tomorrow then things will get better soon.
But tomorrow will be a day with one sided movement, either up or down, no inbetween
hope last day analysis helped you, and you captured a good move

BankNifty Support and Resistance Levels For 12th Nov 2024I’ve created a chart highlighting the key support and resistance levels for #BankNifty, designed to help traders make informed decisions.
These levels provide critical insights for understanding potential price movements, enabling traders to identify ideal entry and exit points.
Use these levels to gain a clearer perspective on Sensex trends and optimize your trades with greater confidence.
Remember, these levels serve as guidance, so always combine them with your own analysis and risk management.

BANKNIFTY--Trendline Liquidity??BankNifty index is facing resistance from 52500 and 52300 levels.
A lot of liquidity is lies below the trendline, keep safe before going long from this area,
price is moving in a channel, we have a chance of breaking the trendline and moving downwards, to test the support levels below, a lot of buy orders are below the support levels at
50200 levels. Keep safe Here.

[INTRADAY] #BANKNIFTY PE & CE Levels(11/11/2024)Today will be flat opening expected in banknifty. After opening if banknifty starts trading below 51450 level then possible strong downside upto 51050 level. Bullish rally expected if banknifty sustain above 51550 level after the opening session. Upside 51950 level will act as a strong resistance for today's session.

BANKNIFTY KEY LEVELS FOR 11/11/2024**Explanation:**
This trading system helps you avoid blind trades by providing confirmation for better entries and exits. It considers volume, past prices, price range and indiavix.
**Entry/Exit Points:**
- **Entry/Exit Lines:** Use the BLACK line for long trades and the RED line for short trades, based on confirmation from your trading plan.
- **Stop Loss:** For long trades, set the stop loss at the RED line below. For short trades, set it at the BLACK line above.
- **Take Profit:** For long trades, target the next RED line above. For short trades, target the next BLACK line below.
**Timeframe:**
Use a 5 timeframe for trading.
**Risk Disclaimer:**
This setup is for educational purposes. I'm not responsible for your gains or losses. Check the chart for more details.

BANKNIFTY : Trading Levels and Plan for 04-Nov-2024
Bank Nifty Trading Plan – 11-Nov-2024
Intro:
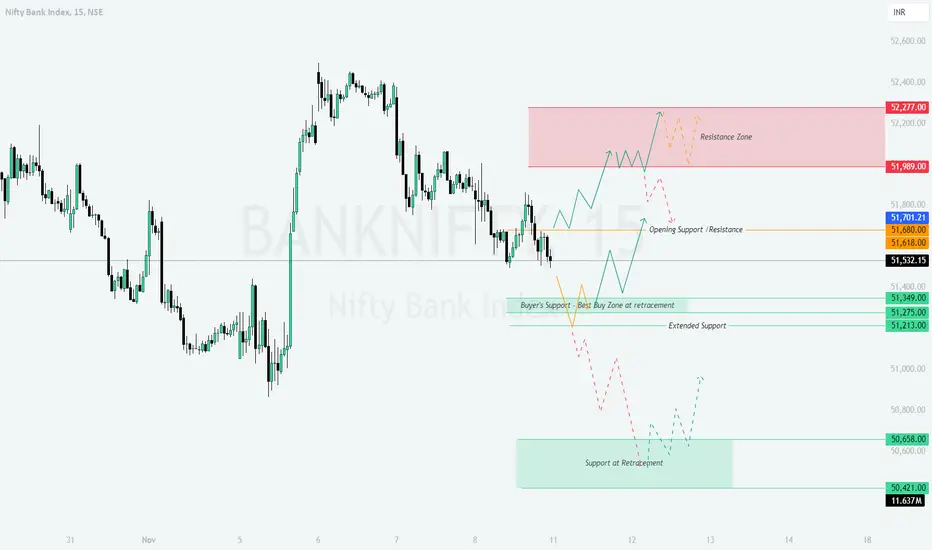
On the previous trading day, Bank Nifty exhibited distinct zones for resistance, support, and retracement areas, giving us a clear range to work with. The yellow trend lines represent periods of sideways movement, green indicates a bullish trend, and red represents a bearish trend. Key resistance is observed around 52,277, while support is at 51,275. Here’s a detailed plan based on possible opening scenarios.
---
Trading Plan for All Opening Scenarios:
Gap Up Opening (200+ Points):
- If Bank Nifty opens with a gap up above the Resistance Zone at 51,989, monitor if it sustains above this level in the first 15-30 minutes.
- Bullish Scenario: A sustained move above 51,989 can lead to a bullish trend toward the higher Resistance Zone at 52,277. Look for buying opportunities on pullbacks toward 51,989 for a potential upside move.
- Bearish Scenario: If it fails to hold above 51,989 and reverses, expect a retracement toward the Opening Support/Resistance at 51,680. Consider short entries below 51,989 with a target toward 51,680 if bearish momentum persists.
Flat Opening:
- If Bank Nifty opens flat around 51,532, wait for the price to stabilize for the first 15-30 minutes before taking any positions.
- Bullish Scenario: A move above 51,680 can trigger a bullish trend with targets toward 51,989. Look for buying entries around 51,680 with support from price action.
- Bearish Scenario: If Bank Nifty breaks below 51,349, expect bearish pressure with targets around the Extended Support at 51,213. Short entries could be considered below 51,349 if bearish signals confirm.
Gap Down Opening (200+ Points):
- A gap down opening below 51,349 could lead to early volatility. Watch if it stabilizes around the Buyer’s Support zone at 51,275.
- Bullish Scenario: If Bank Nifty holds above 51,275 and shows a reversal, consider going long with targets toward the Opening Support at 51,532.
- Bearish Scenario: If selling pressure continues and Bank Nifty breaks below 51,275, expect a move toward the lower Support at Retracement near 50,658. Look for short opportunities below 51,275 with a strict stop loss above 51,275.
---
Risk Management Tips for Options Trading:
- Use hedged positions like vertical spreads to manage risk effectively.
- Maintain a stop-loss level based on daily close to avoid getting stopped out due to intraday volatility.
- Limit position sizes based on your risk tolerance; do not over-leverage.
- Avoid chasing targets; exit around target zones to lock in profits.
---
Summary and Conclusion:
The market structure offers key levels to watch for both support and resistance. Sustaining above 51,989 could signal a bullish move, while a breakdown below 51,275 could lead to further downside. Exercise patience, wait for confirmation around these levels, and manage risk prudently.
---
Disclaimer:
I am not a SEBI-registered analyst. This plan is for educational purposes only. Please perform your analysis or consult a financial advisor before making any trading decisions.
BN continues to trade in the rangeBN formed an indecisive Doji type candle with a negative Bias last week. Quite similar to Nifty.
BN unlike Nifty continues to trade in the range from 50,500 (Lower) to 52,450 (Higher).
We can anticipate 50,800 to be tested this week.
However, if 50,800 also breaks, then we will need to see the intensity of the break.
In the coming weeks perhaps even 50,000 level could get tested.
The crucial support and resistance levels are marked.
Bias continues to be on the short side as long as BN continues to be below 51,650.

BANKNIFTY 4HR CHOCH + BOUNCE FROM FVGBanknifty has given a CHOCH on 4hr Timeframe, it has come to retrace into the fvg, so it can bounce from the fvg to the high of 54500

BANK NIFTY S/R for 11/11/24Support and Resistance Levels:
Support Levels: These are price points (green line/shade) where a downward trend may be halted due to a concentration of buying interest. Imagine them as a safety net where buyers step in, preventing further decline.
Resistance Levels: Conversely, resistance levels (red line/shade) are where upward trends might stall due to increased selling interest. They act like a ceiling where sellers come in to push prices down.
Breakouts:
Bullish Breakout: When the price moves above resistance, it often indicates strong buying interest and the potential for a continued uptrend. Traders may view this as a signal to buy or hold.
Bearish Breakout: When the price falls below support, it can signal strong selling interest and the potential for a continued downtrend. Traders might see this as a cue to sell or avoid buying.
20 EMA (Exponential Moving Average):
Above 20 EMA(50 EMA): If the stock price is above the 20 EMA, it suggests a potential uptrend or bullish momentum.
Below 20 EMA: If the stock price is below the 20 EMA, it indicates a potential downtrend or bearish momentum.
Trendline: A trendline is a straight line drawn on a chart to represent the general direction of a data point set.
Uptrend Line: Drawn by connecting the lows in an upward trend. Indicates that the price is moving higher over time. Acts as a support level, where prices tend to bounce upward.
Downtrend Line: Drawn by connecting the highs in a downward trend. Indicates that the price is moving lower over time. It acts as a resistance level, where prices tend to drop.
RSI: RSI readings greater than the 70 level are overbought territory, and RSI readings lower than the 30 level are considered oversold territory.
Combining RSI with Support and Resistance:
Support Level: This is a price level where a stock tends to find buying interest, preventing it from falling further. If RSI is showing an oversold condition (below 30) and the price is near or at a strong support level, it could be a good buy signal.
Resistance Level: This is a price level where a stock tends to find selling interest, preventing it from rising further. If RSI is showing an overbought condition (above 70) and the price is near or at a strong resistance level, it could be a signal to sell or short the asset.
Disclaimer:
I am not a SEBI registered. The information provided here is for learning purposes only and should not be interpreted as financial advice. Consider the broader market context and consult with a qualified financial advisor before making investment decisions.

Banknifty nov expiry BetBn 52000 ce @ 570
Bn 51500 pe @ 570
Total points 1140
R;R 1;1
sl 250 tgt 500 pts
Reason all u know guys, accident about to happen in Market
its a monthly bet enjoy the roller cost ride ;-)

BankNifty!! 52937 on Monday?The chart says everything. Currently it is telling that 52937 is the next possible target. I am also shocked with this analysis as you are, trust me :|
and you know that my analysis is quite accurate, although I don't know anything about trading :)

BANKNIFTY WEEKLY VIEW - NOVEMBER 2ND WEEK.Banknifty is still not bearish but FII selling is restricting upmove , I'm expecting flat to mild bearish movement in the upcoming week if FII's selling continue , but if they start some buying then we can expect great upmove in banknifty upto 53100+ . On the downside biggest support for bullish structure is 50200.

Bank Nifty May see a CrashIf We see Daily Chart,
We may Clearly Indicate a Head & Shoulder Pattern.
Bank Nifty Has Done its B wave and Ready for the Upcoming C waves.
We may se a Drastic Fall in Bank Nifty in Upcoming Days.
So tighten your Seat bealt, we are Crashing in Bank Nifty
Note : This is for Educational Purpose please Take advice from your financial Advisor before taking any trade.
Have A Good Day traders.

Short BN once it breaks today's LowOnce BN breaches 51,609.05 i.e today's Low, short trade can be initiated on intraday basis.
First Target 51,380.

[INTRADAY] #BANKNIFTY PE & CE Levels(08/11/2024)Today will be slightly gap up opening expected in banknifty. After opening important level is 52000 for index. If banknifty starts trading above 52050 level then possible upside bullish rally upto 400-500 points. Downside expected if banknifty not sustain above level and starts trading below 51950. Downside 51550 will act a immediate support for banknifty.

BANK NIFTY S/R for 8/11/24Support and Resistance Levels:
Support Levels: These are price points (green line/shade) where a downward trend may be halted due to a concentration of buying interest. Imagine them as a safety net where buyers step in, preventing further decline.
Resistance Levels: Conversely, resistance levels (red line/shade) are where upward trends might stall due to increased selling interest. They act like a ceiling where sellers come in to push prices down.
Breakouts:
Bullish Breakout: When the price moves above resistance, it often indicates strong buying interest and the potential for a continued uptrend. Traders may view this as a signal to buy or hold.
Bearish Breakout: When the price falls below support, it can signal strong selling interest and the potential for a continued downtrend. Traders might see this as a cue to sell or avoid buying.
20 EMA (Exponential Moving Average):
Above 20 EMA(50 EMA): If the stock price is above the 20 EMA, it suggests a potential uptrend or bullish momentum.
Below 20 EMA: If the stock price is below the 20 EMA, it indicates a potential downtrend or bearish momentum.
Trendline: A trendline is a straight line drawn on a chart to represent the general direction of a data point set.
Uptrend Line: Drawn by connecting the lows in an upward trend. Indicates that the price is moving higher over time. Acts as a support level, where prices tend to bounce upward.
Downtrend Line: Drawn by connecting the highs in a downward trend. Indicates that the price is moving lower over time. It acts as a resistance level, where prices tend to drop.
RSI: RSI readings greater than the 70 level are overbought territory, and RSI readings lower than the 30 level are considered oversold territory.
Combining RSI with Support and Resistance:
Support Level: This is a price level where a stock tends to find buying interest, preventing it from falling further. If RSI is showing an oversold condition (below 30) and the price is near or at a strong support level, it could be a good buy signal.
Resistance Level: This is a price level where a stock tends to find selling interest, preventing it from rising further. If RSI is showing an overbought condition (above 70) and the price is near or at a strong resistance level, it could be a signal to sell or short the asset.
Disclaimer:
I am not a SEBI registered. The information provided here is for learning purposes only and should not be interpreted as financial advice. Consider the broader market context and consult with a qualified financial advisor before making investment decisions.

BANKNIFTY : Levels and Trading Plan for 08-Nov-2024
Previous Day’s Chart Overview:
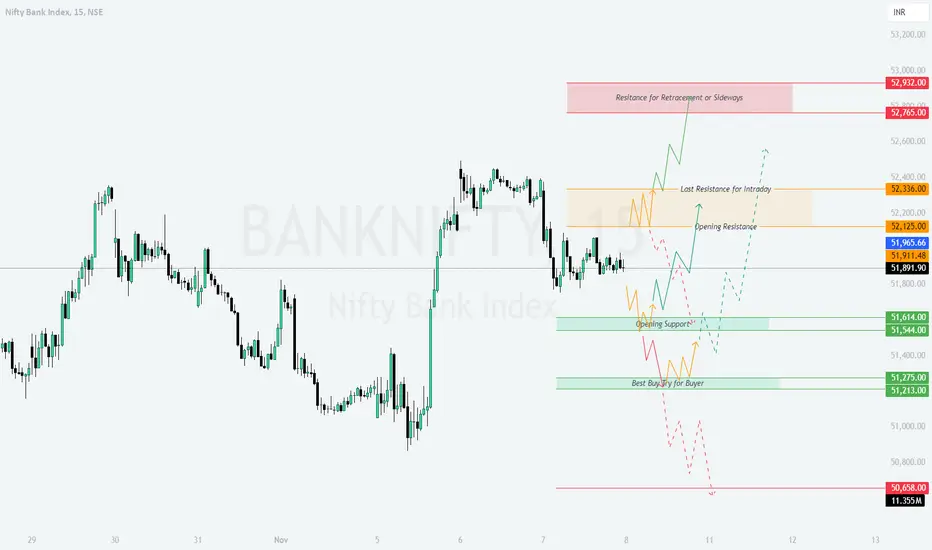
On 07-Nov-2024, Bank Nifty experienced mixed movements, with a notable consolidation phase following an initial upward trend. The chart identifies crucial levels of support and resistance that may impact price action on 08-Nov. The Yellow trend shows a sideways movement, the Green trend represents a bullish outlook, and the Red trend indicates possible bearish paths.
---
Trading Plan for 08-Nov-2024
Gap Up Opening (200+ points):
If Bank Nifty opens above 52,125.00 (Opening Resistance) and sustains, consider taking long positions on pullbacks near this level, targeting the next intraday resistance at 52,336.00 .
If Bank Nifty faces resistance near 52,336.00, look for shorting opportunities with a quick pullback target to 52,125.00.
A breakout above 52,336.00 may open doors towards the 52,765.00 - 52,932.00 range, where sideways resistance might curb the bullish momentum. Manage your profits or trail stops within this zone.
Flat Opening (within ±100 points):
If Bank Nifty opens near 51,911.48 and sustains above the 51,965.66 - 51,911.48 zone, look for long opportunities targeting 52,125.00 (Opening Resistance) .
Should it fail to hold the 51,911.48 level, be cautious as it may move down to test 51,614.00 (Opening Support) . Look for buying opportunities here if support holds.
If Bank Nifty consolidates between 51,911.48 and 51,614.00 , consider light trades only when there’s a breakout in either direction.
Gap Down Opening (200+ points):
In the event of a gap down near 51,614.00 (Opening Support) , watch for any buying pressure at this level. A strong bullish reaction here could provide an entry opportunity with targets toward 51,911.48 and 52,125.00 .
A breakdown below 51,614.00 could lead to further bearish movement towards 51,275.00 (Best Buy for Buyer) . Short positions may be favorable here, with stops around the opening support zone.
If Bank Nifty continues to slide below 51,275.00 , the next crucial level is 51,213.00 , a potential reversal point. Observe if support builds here for a trend reversal.
Risk Management Tips for Options Trading:
Set stop-losses strictly, especially near major support and resistance levels, to minimize downside risks.
Consider smaller position sizes and use out-of-the-money options to manage premiums in high volatility.
Utilize hedging strategies, such as spreads, to protect against unpredictable market swings.
Summary & Conclusion:
Bank Nifty’s price action on 08-Nov could provide significant trading opportunities, especially around key support and resistance zones. Exercise caution at the “Best Buy for Buyer” level around 51,275.00, as it could potentially lead to a reversal. Prioritize risk management to protect capital in volatile markets.
---
Disclaimer:
I am not a SEBI-registered analyst. This analysis is for educational purposes only and should not be considered as investment advice. Please consult a financial advisor before making trading decisions.
BankNifty Support and Resistance Levels For 8th Nov 2024I’ve created a chart highlighting the key support and resistance levels for #Banknifty, designed to help traders make informed decisions.
These levels provide critical insights for understanding potential price movements, enabling traders to identify ideal entry and exit points.
Use these levels to gain a clearer perspective on Sensex trends and optimize your trades with greater confidence.
Remember, these levels serve as guidance, so always combine them with your own analysis and risk management.
